# 3D bar charts in VTK?
**URL:** https://discourse.vtk.org/t/3d-bar-charts-in-vtk/8953
**Category:** Support
**Created:** [July 14, 2022, 6:01pm UTC](https://discourse.vtk.org/t/3d-bar-charts-in-vtk/8953 "2022-07-14T18:01:14Z")
**Posts on this page:** 5
**Page:** 1
### Author:  [@DStranz](https://discourse.vtk.org/u/DStranz)
#### Post date: [July 14, 2022, 6:01pm UTC](https://discourse.vtk.org/t/3d-bar-charts-in-vtk/8953/1 "2022-07-14T18:01:14Z")
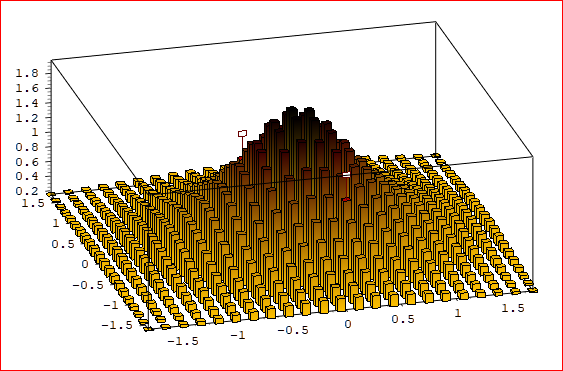
I would like to implement a 3D bar chart similar to this (from qwt3D) or what is available in matplotlib. Is there any such class in VTK? If not can I ask for some pointers about how to get started?
Thanks.
---
### Author:  [@banesullivan](https://discourse.vtk.org/u/banesullivan)
#### Post date: [July 14, 2022, 9:04pm UTC](https://discourse.vtk.org/t/3d-bar-charts-in-vtk/8953/2 "2022-07-14T21:04:06Z")
You could make the bars as individual geometries and plot with pyvista like so:
```python
import numpy as np
import pyvista as pv
# Make up some data - gaussian
n = 20
x = np.linspace(-200, 200, num=n)
y = np.linspace(-200, 200, num=n)
xx, yy = np.meshgrid(x, y)
A, b = 50, 100
zz = A * np.exp(-0.5 * ((xx / b) **2.0 + (yy / b)** 2.0))
s = 3
u, v = np.meshgrid(np.arange(n)*s, np.arange(n)*s)
# Make each bar
cubes = pv.MultiBlock()
for point in np.c_[u.reshape(-1), v.reshape(-1), zz.reshape(-1)]:
c = point
c[-1] /=2
bar = pv.Cube(center=c, z_length=point[-1])
cubes.append(bar)
# Plot all bars in 3D
p = pv.Plotter(notebook=0)
p.add_mesh(cubes)
p.show_grid()
p.show()
```

There are quite a number of ways to do this actually, such as with glyphing.
Take a look at pyvista to see more examples like this: [docs.pyvista.org](http://docs.pyvista.org)
---
### Author:  [@DStranz](https://discourse.vtk.org/u/DStranz)
#### Post date: [July 14, 2022, 9:17pm UTC](https://discourse.vtk.org/t/3d-bar-charts-in-vtk/8953/3 "2022-07-14T21:17:03Z")
Thanks. This is in essence what happens in qwt3D - the bars are “enhancements” drawn at the vertices of a 2D mesh. I’m looking for a C++ / VTK solution for use in a Qt-based C++ application, but maybe I can use the PyVista code for some ideas.
---
### Author:  [@mwestphal](https://discourse.vtk.org/u/mwestphal)
#### Post date: [July 19, 2022, 9:29am UTC](https://discourse.vtk.org/t/3d-bar-charts-in-vtk/8953/4 "2022-07-19T09:29:45Z")
VTK support for 3D chart is a bit lacking, but here is the class:
[https://vtk.org/doc/nightly/html/classvtkPlotSurface.html](https://vtk.org/doc/nightly/html/classvtkPlotSurface.html)
---
### Author:  [@DStranz](https://discourse.vtk.org/u/DStranz)
#### Post date: [July 19, 2022, 2:24pm UTC](https://discourse.vtk.org/t/3d-bar-charts-in-vtk/8953/5 "2022-07-19T14:24:33Z")
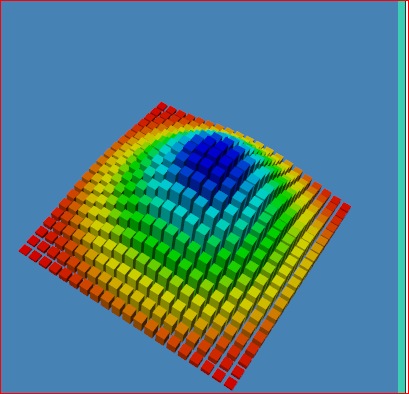
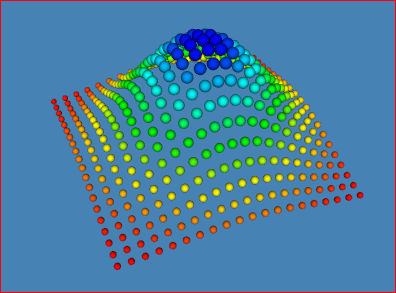
Thanks, Mathieu. I actually have this partly working, using the approach from pyVista - create a vtkMultiBlockDataSet and add bars created from a vtkCubeSource to it. The code is a bit too messy to post, but here’s a screenshot. The nice this is that this model also works for creating 3D scatterplots - simply replace the cubes with spheres.