Dear vtk-ers,
I would like to advertise/announce on this new platform a python module, developed under the support of EMBL (European Molecular Biology Laboratory), which may turn useful to the general VTK community of users.
It is aimed at scientific visualization and research by creating an API which simplifies most common operations, without hiding access to the native vtk objects.
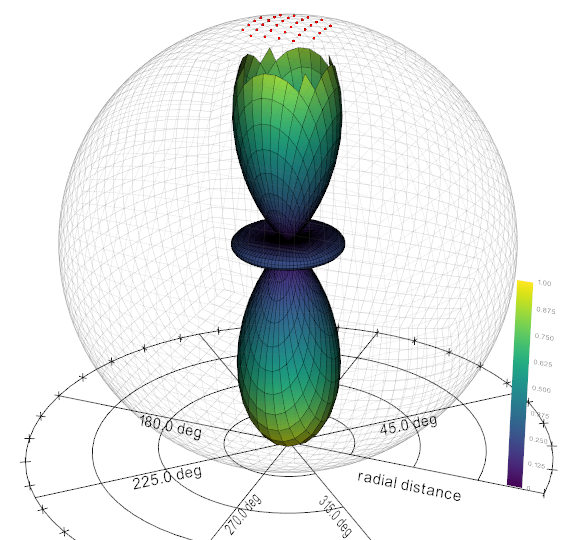
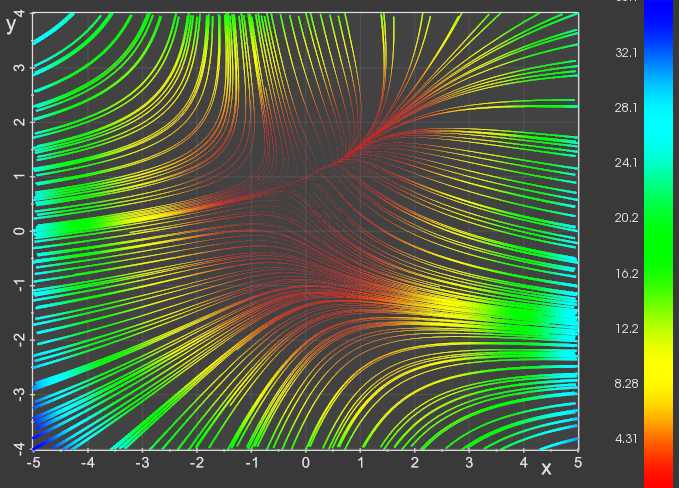
It currently includes more than 100 example scripts (scroll down to see thumbnails) : examples/basic examples/advanced examples/volumetric examples/simulations examples/other.
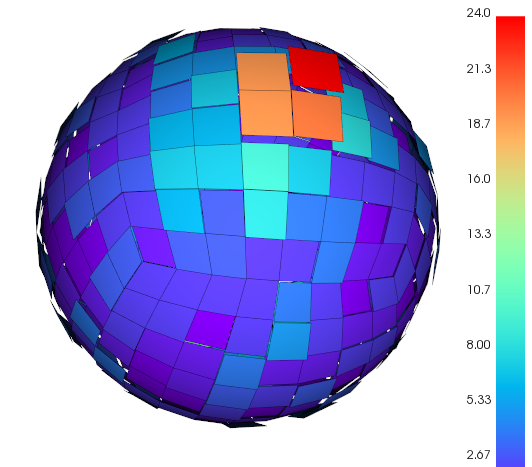
to perform basic functions, some analysis tools, e.g. moving least squares for pointclouds, spherical harmonics expansion, morphing and a bunch of fancy simulations.
Documentation can be found here: vtkplotter.embl.es
Users feedback is always very welcome.
I’m also going to solicit attention for an open-source Python package interfacing to VTK I’ve been contributing to: vtki. It sounds like we have similar goals between vtki and vtkplotter, so perhaps there may be room for interoperability!
With vtki, we directly wrap VTK’s Python objects providing a “pythonic” interface back to the original VTK objects to make the process of editing points and data straightforward, make many common filters easily accessible, and preserve the original VTK data structure such that the objects can be passed to any external routines that accept VTK data objects. Our goal with the plotting routines is to have matplotlib similar/familiar syntax and allow very general control over all the plotting parameters as well as provide some nifty filtering/plotting tools for IPython.
import vtki
import numpy as np
Editing points on a vtki object:
data = vtki.PolyData(np.random.rand(100,3))
data.points[:, -1] = 3
Hi Bane,
indeed they are similar projects which might eventually merge/converge/interact (?).
For sure one important point was for me as well to combine the use of vtkplotter and vtk seamlessly in a program, mantaining the access the full range of vtk classes.
In vtkplotter the above code would translate into:
import vtkplotter
from numpy.random import rand
pts, scals = rand(100,3), rand(100)
# Create directly the Actor(vtkActor):
actor = vtkplotter.Points(pts)
# Editing points:
pts[:, -1] = 3
actor.setPoints(pts)
# Apply some chain of filters/operations:
# (vtkCleanPolyData, vtkTriangleFilter, vtkThreshold, ...):
actor.clean().triangle().threshold(scals, 0.5).mirror().scale(2)
# Plotting:
actor.addScalarBar().show()
# Accessing the original VTK data object:
data = actor.polydata() # vtkPolyData
foo = data.GetPoints()
bar = data.GetPointData().GetArray(0)
oof = data.GetNumberOfCells()
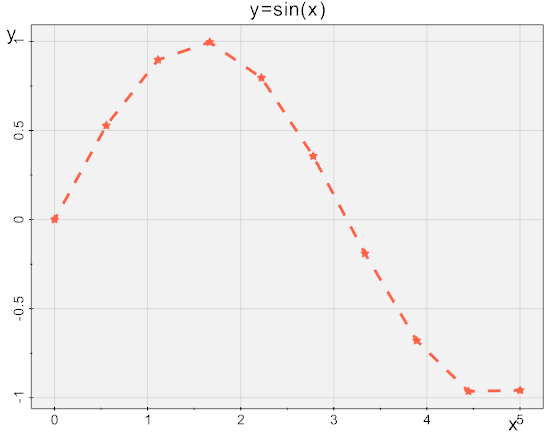
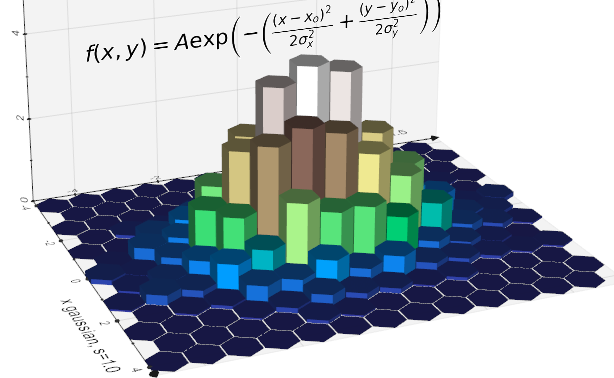
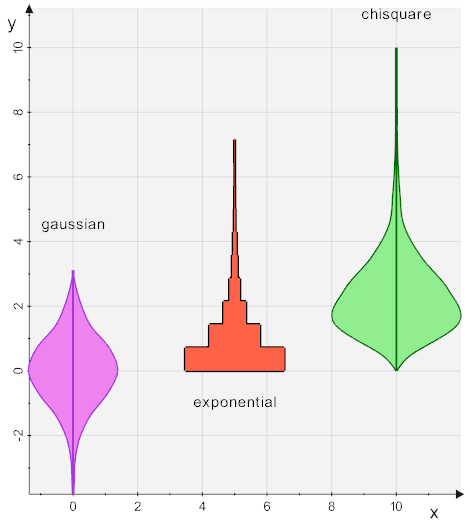
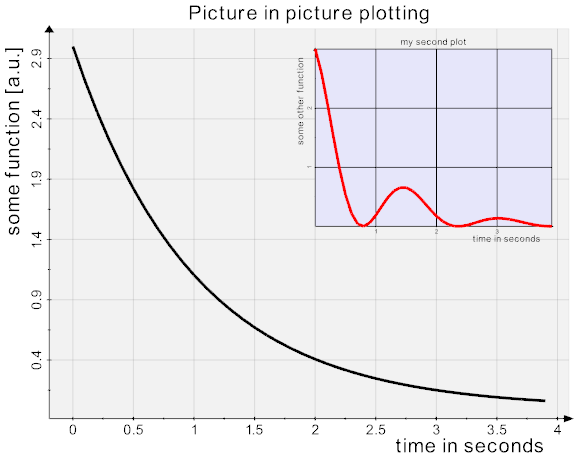
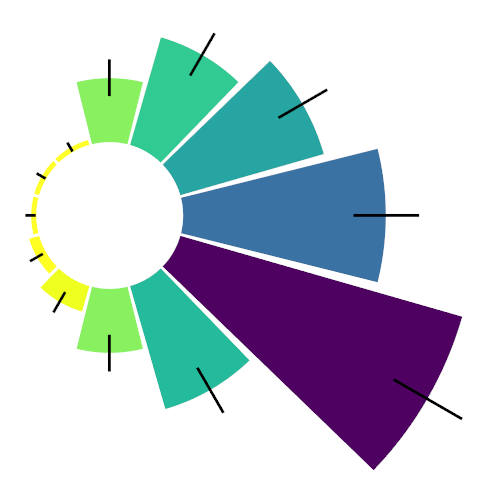
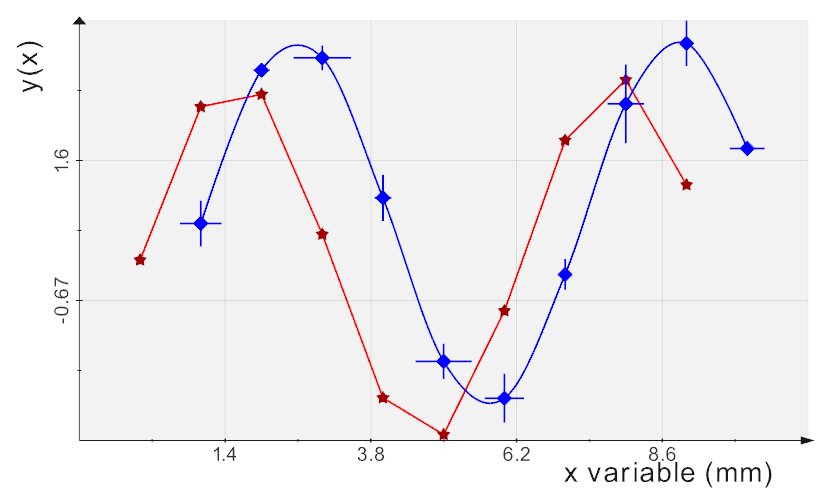
Just wanted to share with you some new developments exploiting the powerful vtkAssembly class that, among other things, allows composing nice plots in a “matplotlib way”. E.g.
import numpy as np, vtk
from vtkplotter import plot

x = np.linspace(0, 5, 10)

plt = plot(x, np.sin(x), '*t--', title='y=sin(x)')

plt.show()

print('is vtkAssembly:', isinstance(plt, vtk.vtkAssembly))