# borehole/well log
**URL:** https://discourse.vtk.org/t/borehole-well-log/9948
**Category:** Support
**Created:** [November 24, 2022, 2:44pm UTC](https://discourse.vtk.org/t/borehole-well-log/9948 "2022-11-24T14:44:46Z")
**Posts on this page:** 8
**Page:** 1
### Author:  [@bistek](https://discourse.vtk.org/u/bistek)
#### Post date: [November 24, 2022, 2:44pm UTC](https://discourse.vtk.org/t/borehole-well-log/9948/1 "2022-11-24T14:44:46Z")
Hello, we are building a geological visualization application and we need to visualize **borehole/well logs** , i.e. parameters recorded along a borehole or a well in the subsurface. The borehole geometry is represented by a polyline (some boreholes are deviated with respect to the vertical axis), i.e. a polydata with polyline cells (possibly a single cell). The parameters should be plot as a sort of “flag plot” on one or both sides of the borehole trace (the symbol on top is not important and can be done with a Glyph):
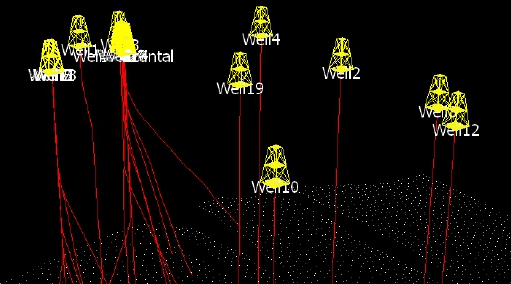
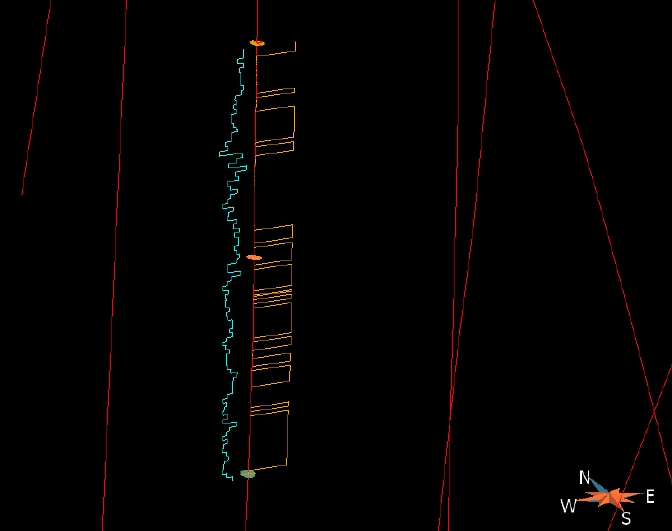
The parameters have a different spatial resolution with respect the well geometry polyline (i.e. temperature measured every 20cm on a borehole where the geometry polyline is recorded every 1m).
We expect to store the parameters on Numpy arrays with some sort of indication of the sampling step along the borehole geometric trace, and then plot as in the examples.
Does anybody have suggestions for this kind of plot?
Thanks very much!
---
### Author:  [@will.schroeder](https://discourse.vtk.org/u/will.schroeder)
#### Post date: [November 26, 2022, 12:19pm UTC](https://discourse.vtk.org/t/borehole-well-log/9948/2 "2022-11-26T12:19:51Z")
I’m not sure this will work for you, but the class Rendering/Annotation/vtkArcPlotter may be a good starting point (also check out the associated test bore.py).
---
### Author:  [@bistek](https://discourse.vtk.org/u/bistek)
#### Post date: [November 26, 2022, 1:01pm UTC](https://discourse.vtk.org/t/borehole-well-log/9948/3 "2022-11-26T13:01:02Z")
Thanks very much!
We have seen the arcPlotter and found the bore.py example but we are not able to locate the input data, so it’s a bit difficult to understand how it works. Do you know where we can find them?
---
### Author:  [@will.schroeder](https://discourse.vtk.org/u/will.schroeder)
#### Post date: [November 26, 2022, 1:36pm UTC](https://discourse.vtk.org/t/borehole-well-log/9948/4 "2022-11-26T13:36:20Z")
VTKData/Data/bore.vtk
---
### Author:  [@bistek](https://discourse.vtk.org/u/bistek)
#### Post date: [November 26, 2022, 2:11pm UTC](https://discourse.vtk.org/t/borehole-well-log/9948/5 "2022-11-26T14:11:58Z")
Thanks very much!! We’ll try and send a feedback.
---
### Author:  [@bistek](https://discourse.vtk.org/u/bistek)
#### Post date: [December 5, 2022, 12:04pm UTC](https://discourse.vtk.org/t/borehole-well-log/9948/6 "2022-12-05T12:04:52Z")
Hello, do you think it is possible to have the plot obtained by vtkArcPlotter to follow the camera, like for instance you do with vtkFollower and text labels?
Thanks!
---
### Author:  [@will.schroeder](https://discourse.vtk.org/u/will.schroeder)
#### Post date: [December 6, 2022, 2:18pm UTC](https://discourse.vtk.org/t/borehole-well-log/9948/7 "2022-12-06T14:18:06Z")
vtkArcPlotter has a vtkCamera instance variable, meaning that the plots will orient themselves wrt the specified camera.
---
### Author:  [@bistek](https://discourse.vtk.org/u/bistek)
#### Post date: [December 6, 2022, 3:34pm UTC](https://discourse.vtk.org/t/borehole-well-log/9948/8 "2022-12-06T15:34:09Z")
Thanks! This solves the issue.