# Calculate slope of surface elevation
**URL:** https://discourse.vtk.org/t/calculate-slope-of-surface-elevation/16458
**Category:** Support
**Tags:** python
**Created:** [June 13, 2026, 2:52pm UTC](https://discourse.vtk.org/t/calculate-slope-of-surface-elevation/16458 "2026-06-13T14:52:17Z")
**Posts on this page:** 2
**Page:** 1
### Author:  [@albgabor](https://discourse.vtk.org/u/albgabor)
#### Post date: [June 13, 2026, 2:52pm UTC](https://discourse.vtk.org/t/calculate-slope-of-surface-elevation/16458/1 "2026-06-13T14:52:17Z")
Hi all,
I’m trying to calculate the slope(s) of a 3D surface.
Specifically I am working on some wind simulations over wavy surfaces, where I can extract some variables (velocities and pressure) from the simulation at the surface into a 3D unstructured mesh. So that I have (x,y,z) points in the vtk file, and some scalars at each point. But in fact z is a single valued function of x and y in my case.
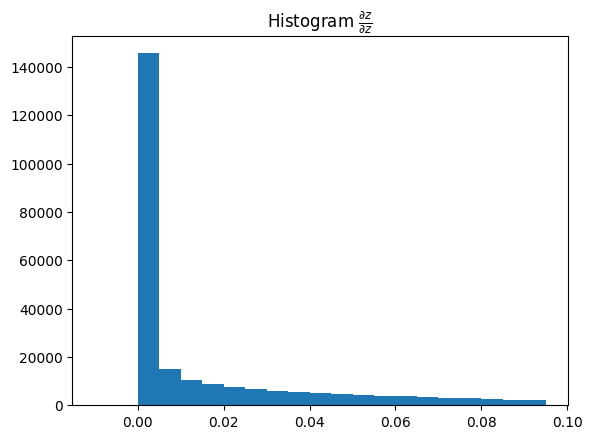
To do so I assign the z coordinate to be a new scalar on the mesh and then calculate the gradient. In the resulting array the first column should be the appropriate dz/dx and the second column the dz/dy, right? I’m just a bit confused about the third column (dz/dz ?), should it be 0 up to some numerical and discretisation errors?
Thanks for the help in advance.
A minimal example using pyvista with one of the standard examples:
```auto
import numpy as np
import pyvista
from matplotlib import pyplot as plt
test=pyvista.examples.download_mount_damavand()
pyvista.plot(test)
plt.show()
test["z"]=test.points[:,2]
test=test.compute_derivative()
#dz/dx
plt.title(r'Histogram $\frac{\partial z}{\partial x}$')
plt.hist(test.point_data['gradient'][:,0],np.arange(-0.2,0.2,0.005))
plt.show()
#dz/dy
plt.title(r'Histogram $\frac{\partial z}{\partial y}$')
plt.hist(test.point_data['gradient'][:,1],np.arange(-0.2,0.2,0.005))
plt.show()
#dz/dz ??
plt.title(r'Histogram $\frac{\partial z}{\partial z}$')
plt.hist(test.point_data['gradient'][:,2],np.arange(-0.01,0.1,0.005))
plt.show()
```
---
### Author:  [@mwestphal](https://discourse.vtk.org/u/mwestphal)
#### Post date: [June 16, 2026, 7:42am UTC](https://discourse.vtk.org/t/calculate-slope-of-surface-elevation/16458/2 "2026-06-16T07:42:13Z")
> [@albgabor](#):
>
> `import pyvista`
Please note this is VTK discourse, pyvista question should be asked on [pyvista/pyvista · Discussions · GitHub](https://github.com/pyvista/pyvista/discussions)