# Color a cut plane over unstructured grid
**URL:** https://discourse.vtk.org/t/color-a-cut-plane-over-unstructured-grid/10135
**Category:** Support
**Created:** [December 9, 2022, 12:06pm UTC](https://discourse.vtk.org/t/color-a-cut-plane-over-unstructured-grid/10135 "2022-12-09T12:06:33Z")
**Posts on this page:** 2
**Page:** 1
### Author:  [@albert](https://discourse.vtk.org/u/albert)
#### Post date: [December 9, 2022, 12:06pm UTC](https://discourse.vtk.org/t/color-a-cut-plane-over-unstructured-grid/10135/1 "2022-12-09T12:06:33Z")
Hi all.
I have a doubt about how to use vtkCutter in my python script.
My workflow is:
- taking an unstructured grid.
- filter it by a VtkThreshold over a scalar, named e.g. ‘A’
- then plot a slice of the filtered-by-threshold ugrid, using VtkCutter, colored by another scalar, say it ‘B’.
Everything works perfectly, but using the lookup table of the ugrid on the slice I obtain only a solid color (while in paraview gui is displaying correctly, see image attached)
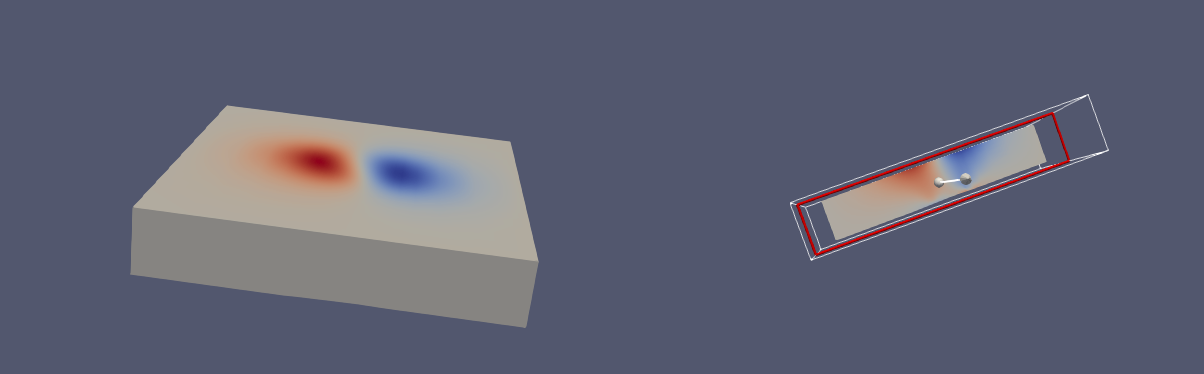
How does it work vtkCutter in vtk library? Does it mantain scarlar data?
Thank you
---
### Author:  [@Jishnu](https://discourse.vtk.org/u/Jishnu)
#### Post date: [December 12, 2022, 3:56am UTC](https://discourse.vtk.org/t/color-a-cut-plane-over-unstructured-grid/10135/2 "2022-12-12T03:56:36Z")
Hi, I am also looking solution to a similar problem. I have a vtkPolydata containing the grid (as vtkPoints) and temperature distribution along the grid as an attribute. I want to plot this as slice plots. I have been looking for a solution for some days but still cannot find any similar examples. Any help is highly appreciated.