# Errorbar plotting in 2D (possibly using vtkPythonItem)
**URL:** https://discourse.vtk.org/t/errorbar-plotting-in-2d-possibly-using-vtkpythonitem/15577
**Category:** Support
**Tags:** python
**Created:** [May 7, 2025, 3:02pm UTC](https://discourse.vtk.org/t/errorbar-plotting-in-2d-possibly-using-vtkpythonitem/15577 "2025-05-07T15:02:37Z")
**Posts on this page:** 4
**Page:** 1
### Author:  [@fraseyboo](https://discourse.vtk.org/u/fraseyboo)
#### Post date: [May 7, 2025, 3:02pm UTC](https://discourse.vtk.org/t/errorbar-plotting-in-2d-possibly-using-vtkpythonitem/15577/1 "2025-05-07T15:02:37Z")
So I’ve been playing around with the 2D plotting capabilities of VTK, in general they have pretty good coverage with the basics (scatter, line plot, bar charts & histograms) and the support for legends, titles and the tooltip is nice. **One notable omission though is an error bar plot**.
I’ve found that vtkPythonItem looks incredibly versatile and could easily mimic the functionality of an errorbar plot along with adding text labels and other niceties, but I haven’t found a good way to get it to work with the axes.
vtkInteractiveArea can be added with AddItem() to either vtkContextScene or vtkChartXY but the results are the same, it behaves more like an overlay than an axes element.
You can see the effect I’m talking about in the image below, because vtkInteractiveArea is its own element the interaction is unbound to the other plots with its own axes, making panning & zooming uncorrelated with the rest of the figure.
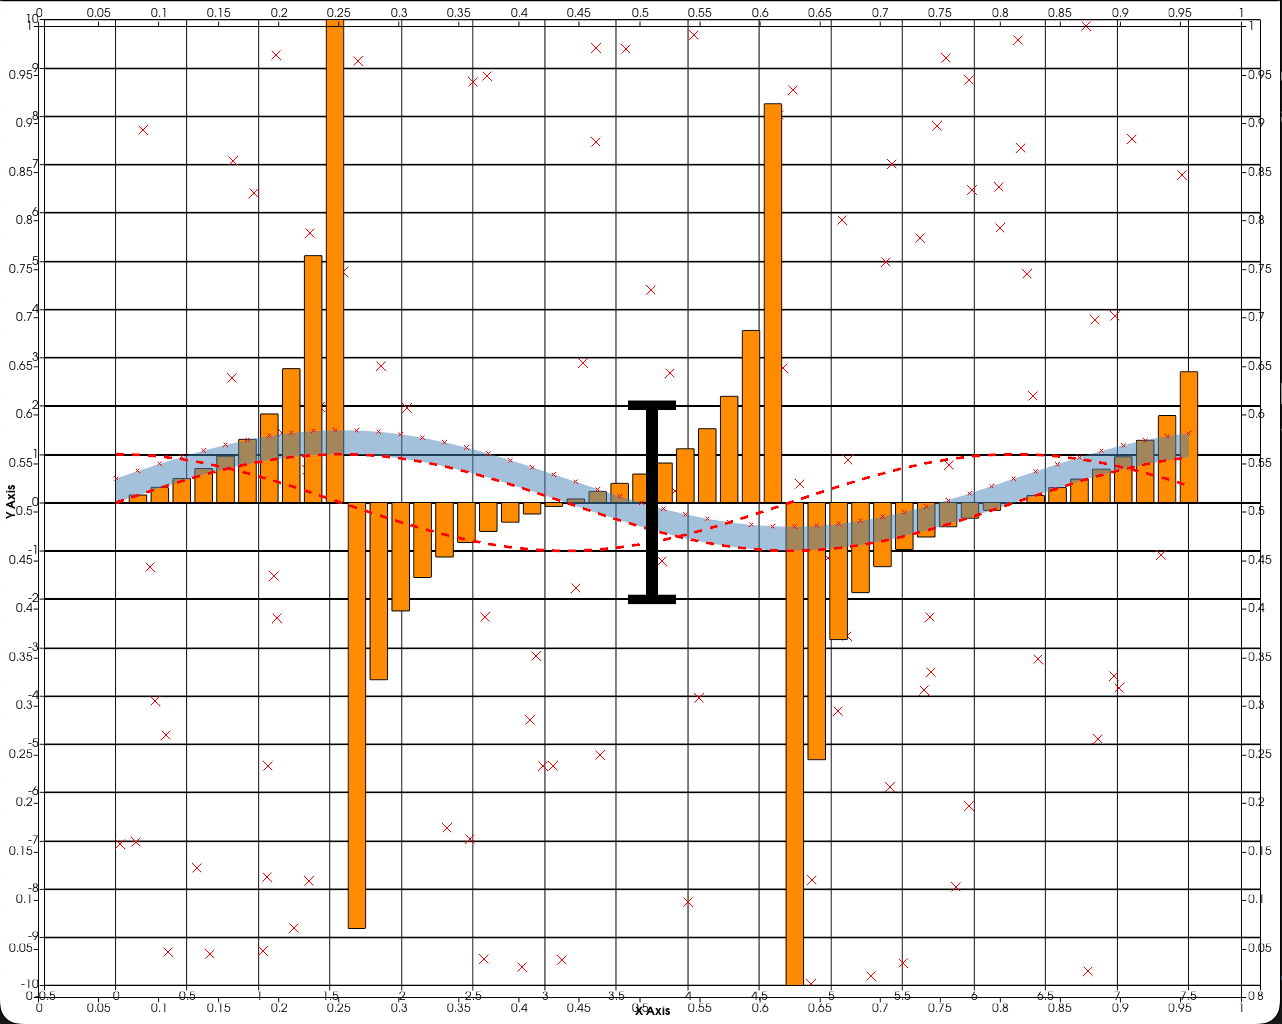
Ideally I’d want the PythonItem to behave like any other chart element and actually move around with the axes.
I saw there was some development in adding errorbar plotting around 6 years ago that didn’t seem to go anywhere, I was hoping there was a moderately simple solution out there until it’s officially supported.
---
### Author:  [@fraseyboo](https://discourse.vtk.org/u/fraseyboo)
#### Post date: [May 7, 2025, 4:11pm UTC](https://discourse.vtk.org/t/errorbar-plotting-in-2d-possibly-using-vtkpythonitem/15577/2 "2025-05-07T16:11:53Z")
It appears that I can access the axes of the plot through GetParent() of the second argument in Paint(), presumably I can then write a small function that translates the (x,y) positions of the poly data into screen space coordinates.
---
### Author:  [@fraseyboo](https://discourse.vtk.org/u/fraseyboo)
#### Post date: [May 7, 2025, 5:33pm UTC](https://discourse.vtk.org/t/errorbar-plotting-in-2d-possibly-using-vtkpythonitem/15577/3 "2025-05-07T17:33:15Z")
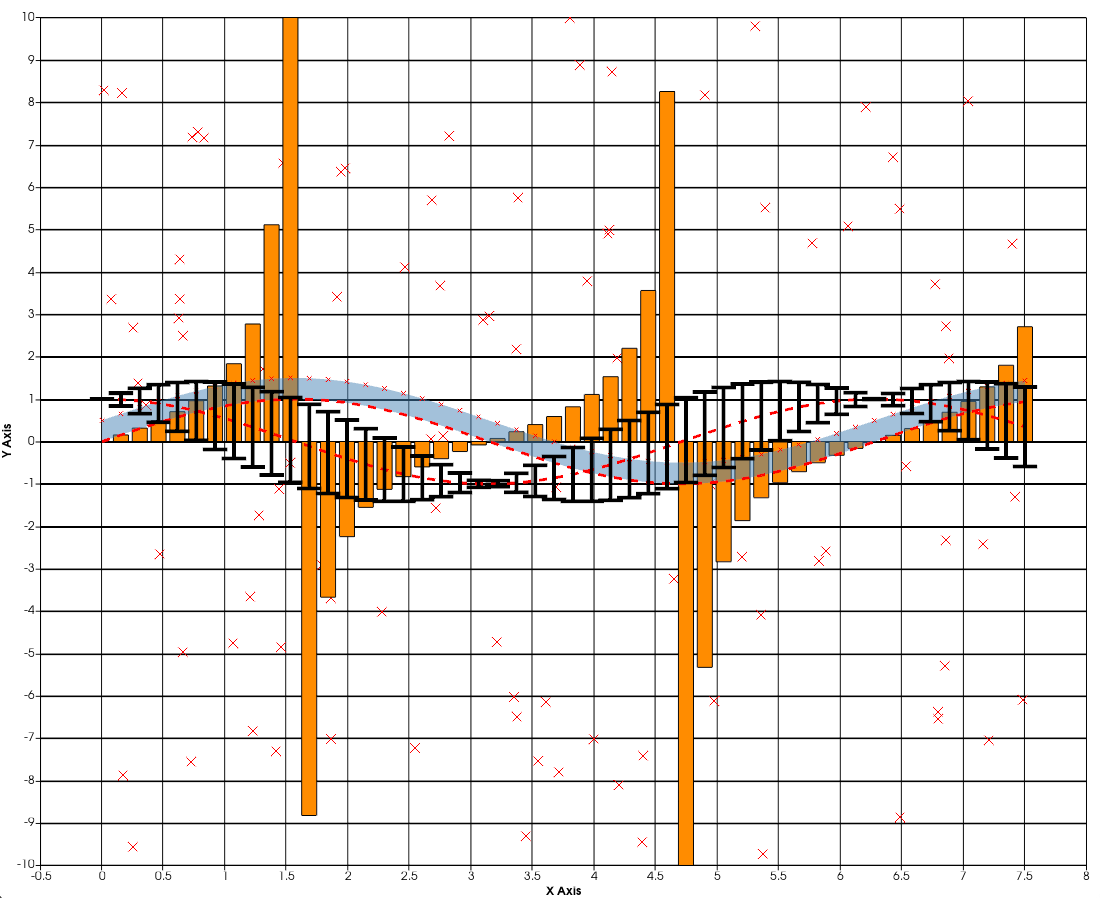
For brevity I’ve attached a working solution for anyone else planning on implementing error bars or any other custom object in a 2D plot that requires scaling. The solution was to look at the parent of the PythonItem and convert the polydata of your object into the appropriate screenspace coordinates from that.
I’ve attached some example code that worked for me, it’s easy enough to modify the PythonItem example code to get it to work. I used AddItem() on one of the vtkChartXY items in my scene.
```auto
def convert_xy_to_screen(self, x, y):
pixel_offset = self.pixel_offset
xy_offset = self.xy_offset
scale = self.scale
px = ((x - xy_offset[0]) * scale[0]) + pixel_offset[0]
py = ((y - xy_offset[1]) * scale[1]) + pixel_offset[1]
return px, py
def scale_polydata(self, polydata):
points = polydata.GetPoints()
new_points = vtk.vtkPoints()
for i in range(points.GetNumberOfPoints()):
point = points.GetPoint(i)
point2D = self.convert_xy_to_screen(point[0], point[1])
new_points.InsertNextPoint(point2D[0], point2D[1], 0.0)
polydata.SetPoints(new_points)
return polydata
def Paint(self, vtkSelf, context2D):
parent = vtkSelf.GetParent()
xaxis = parent.GetAxis(1)
yaxis = parent.GetAxis(0)
xp1 = xaxis.GetPoint1()
xp2 = xaxis.GetPoint2()
xmin = xaxis.GetMinimum()
xmax = xaxis.GetMaximum()
yp1 = yaxis.GetPoint1()
yp2 = yaxis.GetPoint2()
ymin = yaxis.GetMinimum()
ymax = yaxis.GetMaximum()
self.pixel_offset = [xp1[0], yp1[1]]
self.xy_offset = [xmin, ymin]
self.scale = [
(xp2[0] - xp1[0]) / (xmax - xmin),
(yp2[1] - yp1[1]) / (ymax - ymin),
]
pen = context2D.GetPen()
brush = context2D.GetBrush()
pen.SetWidth(self.symbol_thickness)
pen.SetOpacity(255)
pen.SetColor([200, 200, 30])
brush.SetColor(self.color)
brush.SetOpacity(255)
new_polydata = self.build_I_symbol()
scaled_polydata = self.scale_polydata(new_polydata)
context2D.DrawPolyData(
0.0,
0.0,
scaled_polydata,
self.polydata.GetCellData().GetScalars(),
vtk.VTK_SCALAR_MODE_USE_CELL_DATA,
)
return True
```
The result is pretty nice, still needs a little more work to properly customise but overall I’m happy.
---
### Author:  [@fraseyboo](https://discourse.vtk.org/u/fraseyboo)
#### Post date: [May 8, 2025, 12:52pm UTC](https://discourse.vtk.org/t/errorbar-plotting-in-2d-possibly-using-vtkpythonitem/15577/4 "2025-05-08T12:52:22Z")
There also appears to be the method vtkContextTransform that can probably handle the scaling too, I had some problems with the polydata of the PythonItem being modified to weird values which is why they get recalculated within Paint() but this method is likely the more ‘proper’ vtk solution.