# Filled contours / discrete number of colors
**URL:** https://discourse.vtk.org/t/filled-contours-discrete-number-of-colors/537
**Category:** Support
**Created:** [March 19, 2019, 6:04pm UTC](https://discourse.vtk.org/t/filled-contours-discrete-number-of-colors/537 "2019-03-19T18:04:47Z")
**Posts on this page:** 6
**Page:** 1
### Author:  [@lucasouto](https://discourse.vtk.org/u/lucasouto)
#### Post date: [March 19, 2019, 6:04pm UTC](https://discourse.vtk.org/t/filled-contours-discrete-number-of-colors/537/1 "2019-03-19T18:04:47Z")
Hi, I’m new to VTK and any help would be appreciated.
I’m trying to visualize unstructured data with VTK and Python.
So far I managed to visualize temperature on a plate like this:
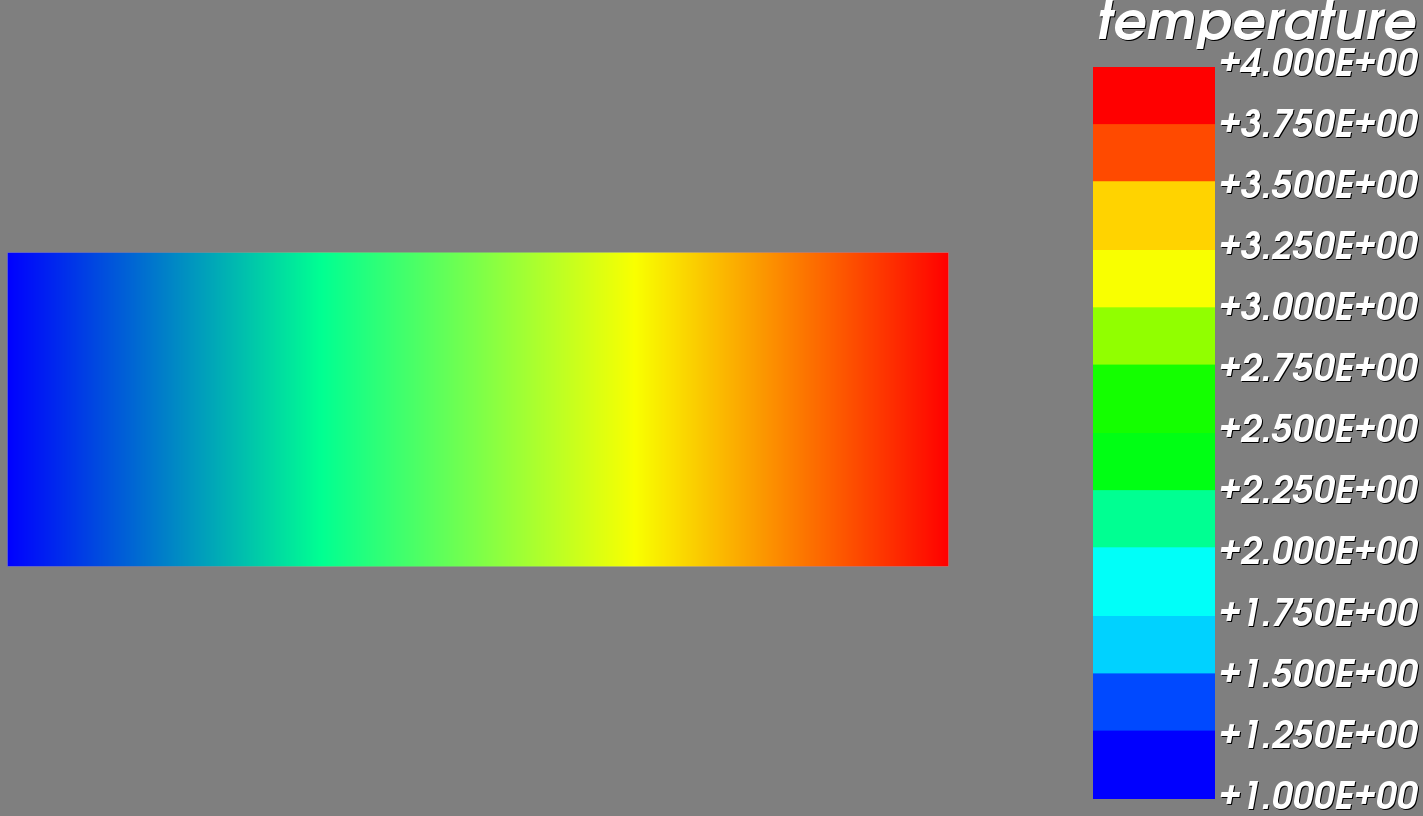
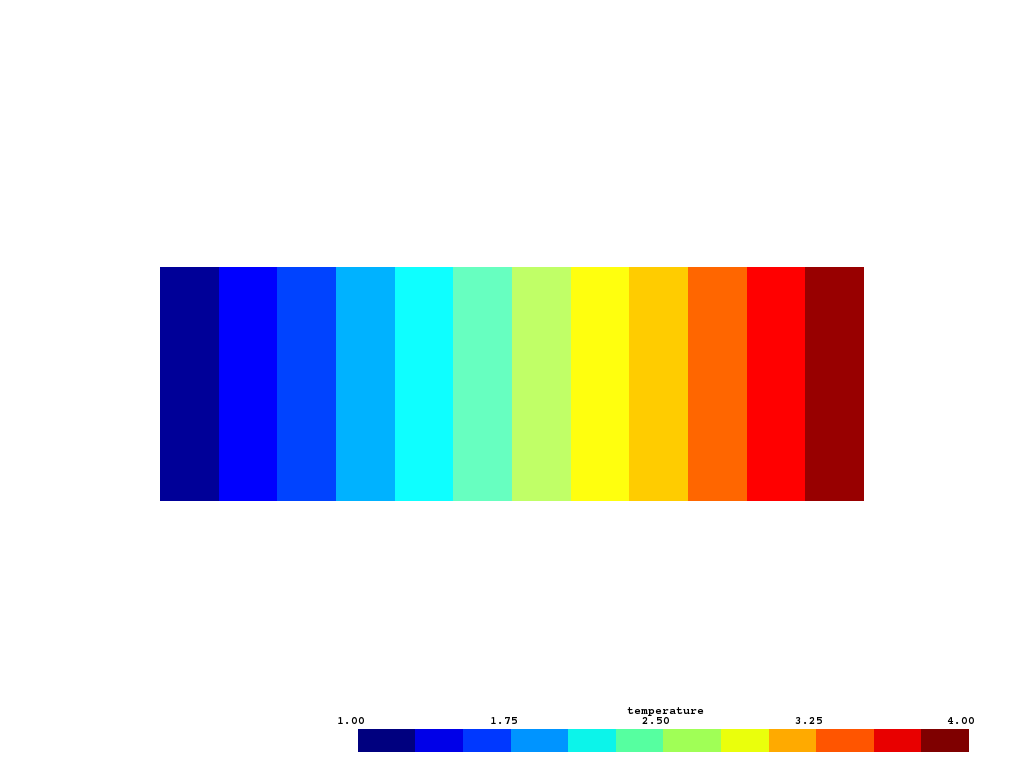
But I need the plate to only show the 12 colors (or any other number of colors), like this:

my python code:
```
import vtk
# file and scalars name
fileName = "stripSimple.vtk"
scalarsName = "temperature"
numberOfColors = 12
# reader
reader = vtk.vtkUnstructuredGridReader()
reader.SetFileName(fileName)
reader.SetScalarsName(scalarsName)
reader.Update()
# data (scalars) range
dataRange = reader.GetOutput().GetPointData().GetScalars().GetRange()
# lookup table
lut = vtk.vtkLookupTable()
lut.SetNumberOfColors(numberOfColors)
lut.SetHueRange(0.667, 0.0)
lut.Build()
# mapper
dataMapper = vtk.vtkDataSetMapper()
dataMapper.SetInputConnection(reader.GetOutputPort())
dataMapper.SetScalarRange(dataRange)
dataMapper.SetLookupTable(lut)
# dataMapper actor
dataActor = vtk.vtkActor()
dataActor.SetMapper(dataMapper)
# scalarBar actor
scalarBar = vtk.vtkScalarBarActor()
scalarBar.SetLookupTable(lut)
scalarBar.SetTitle(scalarsName)
scalarBar.SetNumberOfLabels(numberOfColors + 1)
scalarBar.SetLabelFormat('%+2.3E')
# renderer
ren = vtk.vtkRenderer()
ren.AddActor(dataActor)
ren.AddActor2D(scalarBar)
ren.SetBackground(0.5, 0.5, 0.5)
# window
renWin = vtk.vtkRenderWindow()
renWin.AddRenderer(ren)
renWin.SetSize(500, 500)
# interactor
iren = vtk.vtkRenderWindowInteractor()
iren.SetRenderWindow(renWin)
iren.SetInteractorStyle(vtk.vtkInteractorStyleTrackballCamera())
# start
iren.Start()
```
My “stripSimple.vtk” file:
```
# vtk DataFile Version 3.0
ASCII
DATASET UNSTRUCTURED_GRID
POINTS 8 float
0 0 2
1 0 2
1 1 2
0 1 2
2 0 2
3 0 2
3 1 2
2 1 2
CELLS 6 24
3 0 1 2
3 0 2 3
3 1 4 2
3 4 7 2
3 4 5 7
3 5 6 7
CELL_TYPES 6
5
5
5
5
5
5
POINT_DATA 8
SCALARS temperature float 1
LOOKUP_TABLE default
1.0 2.0 2.0 1.0
3.0 4.0 4.0 3.0
SCALARS density float 1
LOOKUP_TABLE default
-6.0 1.0 2.0 -1.0
9.0 4.0 -5.0 9.0
CELL_DATA 6
SCALARS subdomains int 1
LOOKUP_TABLE default
0 0 1 1 2 2
```
---
### Author:  [@banesullivan](https://discourse.vtk.org/u/banesullivan)
#### Post date: [March 19, 2019, 6:55pm UTC](https://discourse.vtk.org/t/filled-contours-discrete-number-of-colors/537/2 "2019-03-19T18:55:34Z")
You may want to try a `vtkPointDataToCellData` filter so that the data on the nodes aren’t interpolated across your surface
[https://vtk.org/doc/nightly/html/classvtkPointDataToCellData.html](https://vtk.org/doc/nightly/html/classvtkPointDataToCellData.html)
---
### Author:  [@lucasouto](https://discourse.vtk.org/u/lucasouto)
#### Post date: [March 19, 2019, 7:10pm UTC](https://discourse.vtk.org/t/filled-contours-discrete-number-of-colors/537/3 "2019-03-19T19:10:25Z")
> [@banesullivan](#):
>
> `vtkPointDataToCellData`
But I want the data from the nodes to be interpolated in order to see the continuous distribution of the temperature. But I want that interpolation to be done only with the colors of the color bar so it’s easier to check what is the value of the temp on some point of the plate.
---
### Author:  [@lucasouto](https://discourse.vtk.org/u/lucasouto)
#### Post date: [March 19, 2019, 11:30pm UTC](https://discourse.vtk.org/t/filled-contours-discrete-number-of-colors/537/4 "2019-03-19T23:30:55Z")
Found what I wanted:
`dataMapper.SetInterpolateScalarsBeforeMapping(1)`
Which gives exactly the second image.
---
### Author:  [@banesullivan](https://discourse.vtk.org/u/banesullivan)
#### Post date: [March 20, 2019, 2:12am UTC](https://discourse.vtk.org/t/filled-contours-discrete-number-of-colors/537/5 "2019-03-20T02:12:34Z")
Ah yes! FYI: [`vtki`](http://docs.vtki.org) has this ability. Your code translates to:
```python
import vtki
mesh = vtki.read('stripSimple.vtk')
mesh.plot(n_colors=12, interpolate_before_map=True, cpos='xy', cmap='jet')
```
---
### Author:  [@mario.Li](https://discourse.vtk.org/u/mario.Li)
#### Post date: [December 22, 2023, 10:04am UTC](https://discourse.vtk.org/t/filled-contours-discrete-number-of-colors/537/6 "2023-12-22T10:04:58Z")
thanks,very good.