# Help with explaining differences between Paraview Glance and VTK visualisation
**URL:** https://discourse.vtk.org/t/help-with-explaining-differences-between-paraview-glance-and-vtk-visualisation/4133
**Category:** Support
**Created:** [September 3, 2020, 4:26am UTC](https://discourse.vtk.org/t/help-with-explaining-differences-between-paraview-glance-and-vtk-visualisation/4133 "2020-09-03T04:26:35Z")
**Posts on this page:** 5
**Page:** 1
### Author:  [@mattbatchelor](https://discourse.vtk.org/u/mattbatchelor)
#### Post date: [September 3, 2020, 4:26am UTC](https://discourse.vtk.org/t/help-with-explaining-differences-between-paraview-glance-and-vtk-visualisation/4133/1 "2020-09-03T04:26:35Z")
I am trying to visualise some CFD data from a VTU file (exported from XFlow). When I check the results in Paraview Glance it looks like this
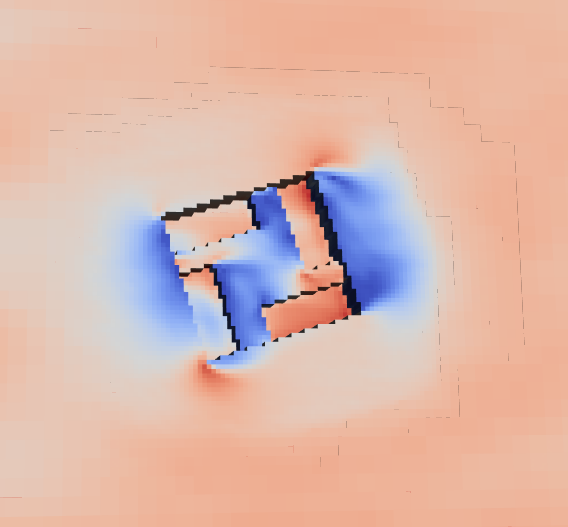
which is correct, however when I load it in VTK and present the same cell data it looks very different 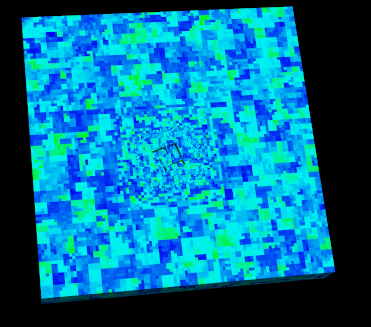
Can anyone explain what could be causing this difference? I’ll paste my code and the vtu file below
Thank you
```
import vtk
filename = 'data/xfdata000050Average.vtu'
reader = vtk.vtkXMLUnstructuredGridReader()
reader.SetFileName(filename)
reader.Update()
outputData = reader.GetOutput()
geoFilter = vtk.vtkGeometryFilter()
# geoFilter.SetInputConnection(outputData)
geoFilter.SetInputConnection(reader.GetOutputPort())
geoFilter.Update()
polydata = geoFilter.GetOutput()
cellData = outputData.GetCellData().GetArray('VelocityModule')
polydata.GetCellData().SetScalars(cellData)
mapper = vtk.vtkPolyDataMapper()
mapper.SetInputData(polydata)
# mapper.InterpolateScalarsBeforeMappingOn()
mapper.Update()
mapper.SetScalarRange(0.08176144979073013, 10.231158699036726)
actor = vtk.vtkActor()
actor.SetMapper(mapper)
# actor.GetProperty().SetOpacity(0.9)
#RENDERING
renderer = vtk.vtkRenderer()
renderer.AddActor(actor)
renderWindow = vtk.vtkRenderWindow()
renderWindow.AddRenderer(renderer)
renderWindow.SetSize(500,500)
renderWindowInteractor = vtk.vtkRenderWindowInteractor()
renderWindowInteractor.SetRenderWindow(renderWindow)
interactorStyle = vtk.vtkInteractorStyleTrackballCamera()
renderWindowInteractor.SetInteractorStyle(interactorStyle)
renderWindowInteractor.Initialize()
renderWindow.Render()
renderWindowInteractor.Start()
```
VTU File:
```
```
---
### Author:  [@Sebastien\_Jourdain](https://discourse.vtk.org/u/Sebastien_Jourdain)
#### Post date: [September 3, 2020, 3:07pm UTC](https://discourse.vtk.org/t/help-with-explaining-differences-between-paraview-glance-and-vtk-visualisation/4133/2 "2020-09-03T15:07:35Z")
You don’t need to do all the data manipulation that you are doing inside your C++ code. You should just load your unstructured grid and render it via the proper mapper. You can see a simple example here:
[https://lorensen.github.io/VTKExamples/site/Cxx/IO/ReadUnstructuredGrid/](https://lorensen.github.io/VTKExamples/site/Cxx/IO/ReadUnstructuredGrid/)
Then you will have to properly configure your mapper to say “I want to color by this array with this lookup table”.
This is what is done on the JS side
>
Which should be converted into C++ call like
```auto
mapper->SetColorByArrayName("VelocityModule");
mapper->SetScalarModeToUseCellData();
mapper->SetInterpolateScalarsBeforeMapping(1);
mapper->SetScalarVisibility(1);
[...]
```
I may still be missing some details, but that is basically the core idea.
---
### Author:  [@mattbatchelor](https://discourse.vtk.org/u/mattbatchelor)
#### Post date: [September 4, 2020, 3:54am UTC](https://discourse.vtk.org/t/help-with-explaining-differences-between-paraview-glance-and-vtk-visualisation/4133/3 "2020-09-04T03:54:16Z")
Thanks Sebastien,
I’m writing this with Python, and I’m getting an error telling me that the vtkDataSetMapper does not have an attribute ‘SetColorByArrayName’
I have written it like this
mapper = vtk.vtkDataSetMapper()
mapper.SetInputConnection(reader.GetOutputPort())
```
mapper.SetColorByArrayName('Velocity')
mapper.SetScalarModeToUseCellData()
mapper.SetInterpolateScalarsBeforeMapping(1)
mapper.SetScalarVisibility()
```
---
### Author:  [@mattbatchelor](https://discourse.vtk.org/u/mattbatchelor)
#### Post date: [September 7, 2020, 4:49am UTC](https://discourse.vtk.org/t/help-with-explaining-differences-between-paraview-glance-and-vtk-visualisation/4133/4 "2020-09-07T04:49:12Z")
I am now attempting to use a cutter to get just a single plane of the data, but all that’s coming out currently is an outline
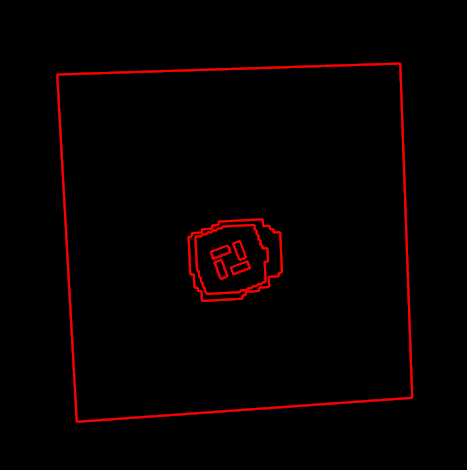
How can I fill in the blank space with colour, based on the same data array I was using above? Is there something else that I need to create based on the cutter information?
@Sebastien_Jourdain @Charles_Gueunet
CODE
#Setting up cutting plane
```
plane = vtk.vtkPlane()
plane.SetOrigin(0, 11.5, 0)
plane.SetNormal(0,1,0)
cutter = vtk.vtkCutter()
cutter.SetCutFunction(plane)
cutter.SetInputData(polydata)
cutter.GenerateCutScalarsOn()
cutter.Update()
cutterMapper = vtk.vtkPolyDataMapper()
cutterMapper.SetInputConnection(cutter.GetOutputPort())
planeActor = vtk.vtkActor()
planeActor.GetProperty().SetColor(1.0,1.0, 0)
planeActor.GetProperty().SetLineWidth(2)
planeActor.SetMapper(cutterMapper)
```
---
### Author:  [@Charles\_Gueunet](https://discourse.vtk.org/u/Charles_Gueunet)
#### Post date: [September 7, 2020, 6:45am UTC](https://discourse.vtk.org/t/help-with-explaining-differences-between-paraview-glance-and-vtk-visualisation/4133/5 "2020-09-07T06:45:00Z")
As your mesh is only a surface, the cutter only outputs the boundary lines. As is, you won’t be able to color the inside of the mesh.
One solution to have a geometry instead of the blank while cutting the mesh may be the [vtkClipClosedSurface](https://vtk.org/doc/nightly/html/classvtkClipClosedSurface.html#details). This does not solve the problem of the scalar values though.
As the mesh is only a surface, there is no data array information inside the mesh. Can you explain how would you like the information inside to be ? (interpolation, constant scalar, projection along an axis…)