# How to add a Colormap to a vtkPolyData
**URL:** https://discourse.vtk.org/t/how-to-add-a-colormap-to-a-vtkpolydata/9979
**Category:** Support
**Created:** [November 28, 2022, 12:12pm UTC](https://discourse.vtk.org/t/how-to-add-a-colormap-to-a-vtkpolydata/9979 "2022-11-28T12:12:45Z")
**Posts on this page:** 9
**Page:** 1
### Author:  [@Hamid\_Fsian](https://discourse.vtk.org/u/Hamid_Fsian)
#### Post date: [November 28, 2022, 12:12pm UTC](https://discourse.vtk.org/t/how-to-add-a-colormap-to-a-vtkpolydata/9979/1 "2022-11-28T12:12:45Z")
Dear Community,
I am trying to color a vtkPolyData by looping through the z-axis, and then see if the width of a slice(i) is \< or \> to a certain value. And then color the slice (over the z-axis) according to this threshold.
Below is the code that I am working on. But the instead of color the slice (over z-axis) it color the slice over (x-axis).
```auto
import vtk, sys
import statistics
# Read in your STL file
f = vtk.vtkSTLReader()
f.SetFileName("my_stl_file.stl")
f.Update() # This is necessary to have the data ready to read.
# The vtkSTLReader reads in your file as a vtkPolyData, 'obj' is a reference to
# that output. I'm using the bounds that are automatically calculated during
# the import phase to give a range for the height of the points in the file.v
# I believe that the bounds are (xmin, xmax, ymin, ymax, zmin, zmax).
obj = f.GetOutputDataObject(0)
min_x , max_x , min_y , max_y ,min_z, max_z = obj.GetBounds()
# I am creating a lookup table to correspond to the height field. I am using
# the default values. Remember that the lookup table is a rather complex and
# handy object, and there are lots of options to set if you need something
# special.
lut_z = vtk.vtkLookupTable()
lut_z.SetTableRange(min_z, max_z)
lut_z.Build()
# This is an array that I am creating to store the heights of the points. I
# will use this as a scalar field on the 'obj' so that the lookup table can be
# used to color it. You could obviously make the array anything you wanted,
# such as ‘x’ or ‘y’ or squared distance from some other point, for instance.
heights = vtk.vtkDoubleArray()
heights.SetName("Z_Value")
width = vtk.vtkDoubleArray()
width.SetName("X_Value")
# Loop through the points in the vtkPolyData and record the height in the
# 'heights' array.
Colors = vtk.vtkUnsignedCharArray()
Colors.SetNumberOfComponents(3)
Colors.SetNumberOfTuples(obj.GetNumberOfCells())
test_xyz = []
test_z = []
for i in range(obj.GetNumberOfPoints()) :
xyz = obj.GetPoint(i)
test_xyz.append(xyz)
if min_x < xyz[0] < 300 :
Colors.InsertTuple3(i,0, 255, 0) # it adding colormap to the x-axis instead of z-axis
else :
Colors.InsertTuple3(i,255,0 , 0) # it adding colormap to the x-axis instead of z-axis
obj.GetPointData().SetScalars(Colors)
mapper = vtk.vtkPolyDataMapper()
mapper.SetInputDataObject(obj)
mapper.SetScalarRange(obj.GetScalarRange())
mapper.SetLookupTable(lut_z)
mapper.SetUseLookupTableScalarRange(True)
actor = vtk.vtkActor()
actor.SetMapper(mapper)
renderer = vtk.vtkRenderer()
renderer.AddActor(actor)
renderer.SetBackground(.1, .2, .4)
renw = vtk.vtkRenderWindow()
renw.AddRenderer(renderer)
iren = vtk.vtkRenderWindowInteractor()
iren.SetRenderWindow(renw)
renw.Render()
iren.Start()
```
---
### Author:  [@jfausty](https://discourse.vtk.org/u/jfausty)
#### Post date: [November 28, 2022, 6:09pm UTC](https://discourse.vtk.org/t/how-to-add-a-colormap-to-a-vtkpolydata/9979/2 "2022-11-28T18:09:56Z")
Hi @Hamid_Fsian,
Thanks for sharing!
You are setting your colors according to a condition on the X coordinate:
```auto
if min_x < xyz[0] < 300 :
Colors.InsertTuple3(i,0, 255, 0) # it adding colormap to the x-axis instead of z-axis
else :
Colors.InsertTuple3(i,255,0 , 0) # it adding colormap to the x-axis instead of z-axis
```
If you want to conditionally set your `Colors` array depending on your Z coordinate, you should test on `xyz[2]` instead of `xyz[0]`.
Hope that is what you’re looking for!
Kind regards,
Julien
---
### Author:  [@Hamid\_Fsian](https://discourse.vtk.org/u/Hamid_Fsian)
#### Post date: [November 29, 2022, 7:38am UTC](https://discourse.vtk.org/t/how-to-add-a-colormap-to-a-vtkpolydata/9979/3 "2022-11-29T07:38:57Z")
Dear Julien,
Thank for your response.
I still need to check the conditions of the x-axis and then color the corresponding z-axis.
I tried what you mentionned but it will color the z axis without taking account of the x-axis values. Can you please help ?
Regards,
Hamid FSIAN
---
### Author:  [@jfausty](https://discourse.vtk.org/u/jfausty)
#### Post date: [November 29, 2022, 8:57am UTC](https://discourse.vtk.org/t/how-to-add-a-colormap-to-a-vtkpolydata/9979/4 "2022-11-29T08:57:07Z")
Hi @Hamid_Fsian,
Perhaps I don’t quite understand what you are trying to do. Do you think it might be possible for you to provide a sketch of what you would like to obtain or maybe the equivalent case in 2D ?
Best regards,
Julien
---
### Author:  [@Hamid\_Fsian](https://discourse.vtk.org/u/Hamid_Fsian)
#### Post date: [November 29, 2022, 9:18am UTC](https://discourse.vtk.org/t/how-to-add-a-colormap-to-a-vtkpolydata/9979/5 "2022-11-29T09:18:04Z")
I am terribly sorry for not being clear.
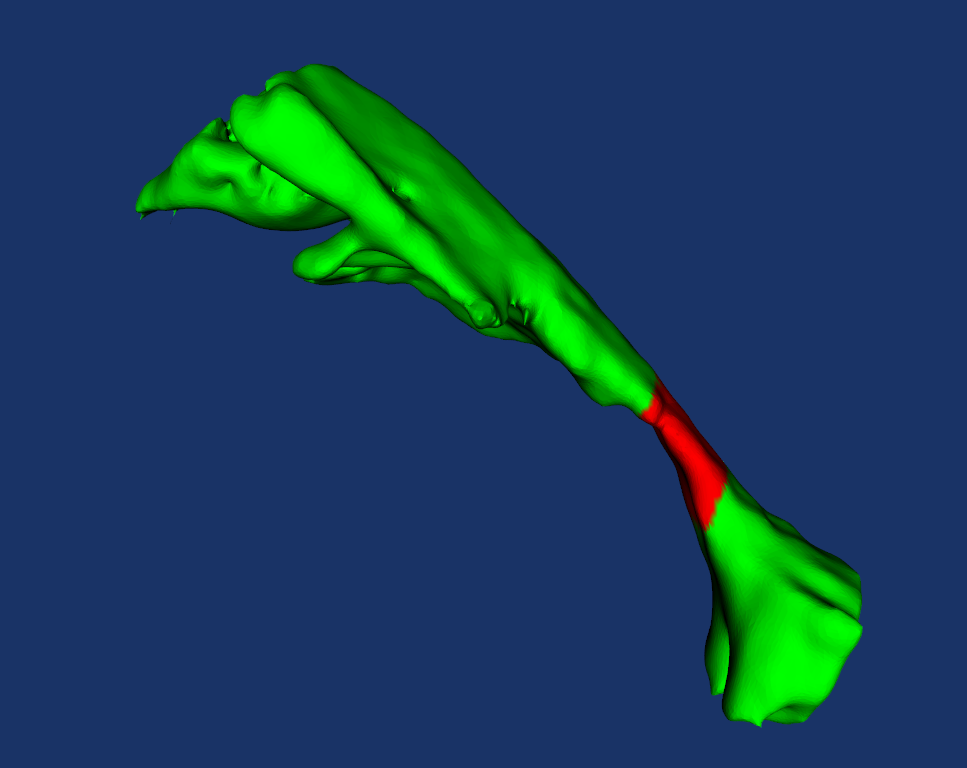
I want to color a 3D object using width and height.
For this matter, I want to parse through each slice (around z-axis) and check if the value of the corresponding x coordinate is \> or \< to a certain threshold.
- if x \> threshold =\> then color the slice (z-axis) in green
- if x \< threshold =\> then color the slice (z-axis) in red
The following figure is the desired output. Thank you
---
### Author:  [@jfausty](https://discourse.vtk.org/u/jfausty)
#### Post date: [November 29, 2022, 9:36am UTC](https://discourse.vtk.org/t/how-to-add-a-colormap-to-a-vtkpolydata/9979/6 "2022-11-29T09:36:22Z")
It is most likely me who is not understanding.
Let me be more precise in trying to get to the root of the matter: When iterating over slices of constant z (`z = a`) there are multiple points that correspond to this slice (i.e. if the underlying object is a 2D surface, a slice will be a 1D curve). All these points have the same z value but not the same x or y values (if they did, they would all be the same point and not a curve).
As such, which point would you like to use to test the x value?
If you would like to test all the points, than you risk not coloring the slice homogeneously (what I believe is happening now in your script). If you do some sort of average than you risk coloring some points with a color even though they do not respect your condition. A minimum or maximum operation on all the points might be the best alternative but could also be quite restrictive.
If you are trying to extract a given zone of your object, you might want to look at the `vtkThreshold` filter for automating this task. Or perhaps create some `vtkSelection` of your zone and use the `vtkExtractSelection` filter.
I hope that helps!
Best regards,
Julien
---
### Author:  [@Hamid\_Fsian](https://discourse.vtk.org/u/Hamid_Fsian)
#### Post date: [November 29, 2022, 9:45am UTC](https://discourse.vtk.org/t/how-to-add-a-colormap-to-a-vtkpolydata/9979/7 "2022-11-29T09:45:33Z")
You are totaly right !.
> [@jfausty](#):
>
> (what I believe is happening now in your script)
I will try to use these methods
> [@jfausty](#):
>
> If you are trying to extract a given zone of your object, you might want to look at the `vtkThreshold` filter for automating this task. Or perhaps create some `vtkSelection` of your zone and use the `vtkExtractSelection` filter.
---
### Author:  [@Hamid\_Fsian](https://discourse.vtk.org/u/Hamid_Fsian)
#### Post date: [November 29, 2022, 11:34am UTC](https://discourse.vtk.org/t/how-to-add-a-colormap-to-a-vtkpolydata/9979/8 "2022-11-29T11:34:11Z")
@jfausty Can you share a code with theses functions ? Thank’s
---
### Author:  [@jfausty](https://discourse.vtk.org/u/jfausty)
#### Post date: [November 29, 2022, 12:37pm UTC](https://discourse.vtk.org/t/how-to-add-a-colormap-to-a-vtkpolydata/9979/9 "2022-11-29T12:37:47Z")
Here is a pretty good resource for VTK example code:
[https://kitware.github.io/vtk-examples/site/](https://kitware.github.io/vtk-examples/site/)
There are a lot of different things in there but with a little time you should find what you are looking for.
Regards,
Julien