# How to add annotation on vtkChartXY
**URL:** https://discourse.vtk.org/t/how-to-add-annotation-on-vtkchartxy/8556
**Category:** Support
**Created:** [May 23, 2022, 2:55pm UTC](https://discourse.vtk.org/t/how-to-add-annotation-on-vtkchartxy/8556 "2022-05-23T14:55:59Z")
**Posts on this page:** 9
**Page:** 1
### Author:  [@zhang-qiang-github](https://discourse.vtk.org/u/zhang-qiang-github)
#### Post date: [May 23, 2022, 2:55pm UTC](https://discourse.vtk.org/t/how-to-add-annotation-on-vtkchartxy/8556/1 "2022-05-23T14:55:59Z")
I want to add an annotation on `vtkChartXY`. The annotation is `vtkTextActor`.
My code is:
```auto
import vtkmodules.all as vtk
import numpy as np
colors = vtk.vtkNamedColors()
table = vtk.vtkTable()
arrX = vtk.vtkFloatArray()
arrX.SetName('X Axis')
table.AddColumn(arrX)
arrC = vtk.vtkFloatArray()
arrC.SetName('Cosine')
table.AddColumn(arrC)
numPoints = 69
inc = 7.5/(numPoints-1)
table.SetNumberOfRows(numPoints)
for i in range(numPoints):
table.SetValue(i, 0, float(i*inc))
table.SetValue(i, 1, float(np.cos(i*inc)))
view = vtk.vtkContextView()
view.GetRenderWindow().SetWindowName('linePlot')
chart = vtk.vtkChartXY()
view.GetScene().AddItem(chart)
line = chart.AddPlot(vtk.vtkChart.LINE)
line.SetInputData(table, 0, 1)
line.SetColor(0, 255, 0, 255)
line.SetWidth(1.0)
txtActor = vtk.vtkTextActor()
txtActor.GetPositionCoordinate().SetCoordinateSystemToNormalizedViewport()
txtActor.GetTextProperty().SetJustificationToLeft()
txtActor.GetTextProperty().SetVerticalJustificationToTop()
txtActor.SetInput('Annotation')
txtActor.SetPosition([0.008, 0.992])
render = list(view.GetRenderWindow().GetRenderers())[0]
render.AddActor(txtActor)
view.GetRenderWindow().Render()
view.GetInteractor().Initialize()
view.GetInteractor().Start()
```
Finally, there is no text:
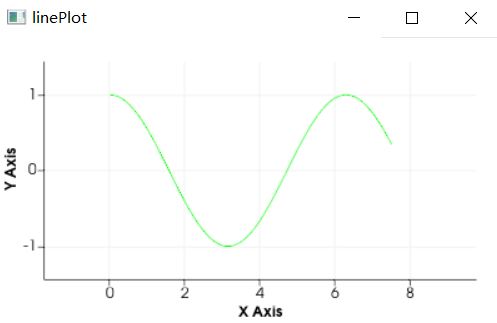
How can I add some text on `vtkChartXY`?
Any suggestion is appreciated~~~
---
### Author:  [@Paulo\_Carvalho](https://discourse.vtk.org/u/Paulo_Carvalho)
#### Post date: [May 24, 2022, 1:54pm UTC](https://discourse.vtk.org/t/how-to-add-annotation-on-vtkchartxy/8556/2 "2022-05-24T13:54:46Z")
Hello,
My two cents: maybe the `vtkTextActor` is behind de chart so it does not appear. Perhaps setting a proper Z coordinate will cause it to show on top of the chart.
regards,
Paulo
---
### Author:  [@zhang-qiang-github](https://discourse.vtk.org/u/zhang-qiang-github)
#### Post date: [May 25, 2022, 9:46am UTC](https://discourse.vtk.org/t/how-to-add-annotation-on-vtkchartxy/8556/3 "2022-05-25T09:46:42Z")
@Paulo_Carvalho Thank you for your kindly reply.
It is confuzed for me. The `vtkTextActor` is added using `normalized viewport`:
```auto
txtActor.GetPositionCoordinate().SetCoordinateSystemToNormalizedViewport()
txtActor.SetPosition([0.008, 0.992])
```
How can I set the `Z` coordinate?
---
### Author:  [@Paulo\_Carvalho](https://discourse.vtk.org/u/Paulo_Carvalho)
#### Post date: [May 25, 2022, 3:25pm UTC](https://discourse.vtk.org/t/how-to-add-annotation-on-vtkchartxy/8556/4 "2022-05-25T15:25:03Z")
Hello,
I’ve never used VTK for 2D rendering. VTK needs to know somehow that the text actor should appear over the chart. If there’s no Z, then there ought to be some other setting (drawing order?).
By normalized I understand that the coordinates vary betwen 0.0 and 1.0 (instead of pixel values, for instance). Normalization, as I understand it, doesn’t mean 2D space. Have you tried adding a third number to `SetPosition()`?
take care,
Paulo
---
### Author:  [@zhang-qiang-github](https://discourse.vtk.org/u/zhang-qiang-github)
#### Post date: [May 26, 2022, 7:20am UTC](https://discourse.vtk.org/t/how-to-add-annotation-on-vtkchartxy/8556/5 "2022-05-26T07:20:44Z")
The `SetPosition` do not support three input. The code `txtActor.SetPosition([0.008, 0.992, 1.0])` report bug:
```auto
TypeError: SetPosition argument 1: expected a sequence of 2 values, got 3 values
```
In addition, I want to check the position of `vtkChartXY`, and my code is:
```auto
render = view.GetRenderer()
actors = list(render.GetActors())
```
But, the `actors` is empty, which means `vtkChartXY` is not an actor, and I cannot check the position. It is stranger.
---
### Author:  [@Paulo\_Carvalho](https://discourse.vtk.org/u/Paulo_Carvalho)
#### Post date: [May 26, 2022, 8:31pm UTC](https://discourse.vtk.org/t/how-to-add-annotation-on-vtkchartxy/8556/6 "2022-05-26T20:31:19Z")
Then I believe you need to use some class of VTK Charts API to achieve the effect you want. I mean, using a `vtkActor` won’t do.
[https://kitware.github.io/vtk-examples/site/Cxx/#plotting](https://kitware.github.io/vtk-examples/site/Cxx/#plotting)
[https://kitware.github.io/vtk-examples/site/Python/#plotting](https://kitware.github.io/vtk-examples/site/Python/#plotting)
---
### Author:  [@zhang-qiang-github](https://discourse.vtk.org/u/zhang-qiang-github)
#### Post date: [May 27, 2022, 1:38am UTC](https://discourse.vtk.org/t/how-to-add-annotation-on-vtkchartxy/8556/7 "2022-05-27T01:38:25Z")
Thank you for your suggestion. I will try these examples to find a solution. If they don’t help, I will read the source code to find how `vtkChartXY` add title/legend or some other annotation.
---
### Author:  [@mwestphal](https://discourse.vtk.org/u/mwestphal)
#### Post date: [June 1, 2022, 8:23am UTC](https://discourse.vtk.org/t/how-to-add-annotation-on-vtkchartxy/8556/8 "2022-06-01T08:23:35Z")
Hi @zhang-qiang-github ,
> [@zhang-qiang-github](#):
>
> `vtkTextActor`
You should use [vtkBlockItem](https://vtk.org/doc/nightly/html/classvtkBlockItem.html#details)
Best,
---
### Author:  [@zhang-qiang-github](https://discourse.vtk.org/u/zhang-qiang-github)
#### Post date: [June 2, 2022, 8:06am UTC](https://discourse.vtk.org/t/how-to-add-annotation-on-vtkchartxy/8556/9 "2022-06-02T08:06:29Z")
Thank you for your kindly suggestion. I will try it.