# How to add intensity value at every point in a point cloud using vtk? I am using python
**URL:** https://discourse.vtk.org/t/how-to-add-intensity-value-at-every-point-in-a-point-cloud-using-vtk-i-am-using-python/349
**Category:** Support
**Created:** [February 28, 2019, 10:21pm UTC](https://discourse.vtk.org/t/how-to-add-intensity-value-at-every-point-in-a-point-cloud-using-vtk-i-am-using-python/349 "2019-02-28T22:21:27Z")
**Posts on this page:** 6
**Page:** 1
### Author:  [@ral](https://discourse.vtk.org/u/ral)
#### Post date: [February 28, 2019, 10:21pm UTC](https://discourse.vtk.org/t/how-to-add-intensity-value-at-every-point-in-a-point-cloud-using-vtk-i-am-using-python/349/1 "2019-02-28T22:21:27Z")
Hello!!
I’m working on this example [https://pastebin.com/reu0dXYj](https://pastebin.com/reu0dXYj) and i want to add intensity value for each point. I know i need to use a lookup table and i think i should use a vtk.vtkFloatArray() with intesity component or vtk.vtkUnsignedCharArray() with R,G,B values. Can someone please give me an example, from where to start … or some useful guidelines?
---
### Author:  [@banesullivan](https://discourse.vtk.org/u/banesullivan)
#### Post date: [March 1, 2019, 2:02am UTC](https://discourse.vtk.org/t/how-to-add-intensity-value-at-every-point-in-a-point-cloud-using-vtk-i-am-using-python/349/2 "2019-03-01T02:02:58Z")
What exactly do you mean by “intensity value”? Can you share a sample point cloud file to which you’d like to do this?
---
### Author:  [@ral](https://discourse.vtk.org/u/ral)
#### Post date: [March 1, 2019, 2:15pm UTC](https://discourse.vtk.org/t/how-to-add-intensity-value-at-every-point-in-a-point-cloud-using-vtk-i-am-using-python/349/3 "2019-03-01T14:15:35Z")
I have files with x, y, z, coordinates and an intensity value for each point.
for example:145 221 448 31.
---
### Author:  [@banesullivan](https://discourse.vtk.org/u/banesullivan)
#### Post date: [March 3, 2019, 1:35am UTC](https://discourse.vtk.org/t/how-to-add-intensity-value-at-every-point-in-a-point-cloud-using-vtk-i-am-using-python/349/4 "2019-03-03T01:35:36Z")
If you simply want to color the “intensity” values, then check out [`vtki`](http://docs.vtki.org/en/latest/):
```python
import numpy as np
import vtki
# Load your point cloud
n = 10000
points = np.random.rand(n, 3)
intensity = np.random.randint(0, 255, n)
# Create a VTK dataset
poly = vtki.PolyData(points)
poly.point_arrays['intensity'] = intensity
# Plot the point cloud
poly.plot(cmap='viridis')
```
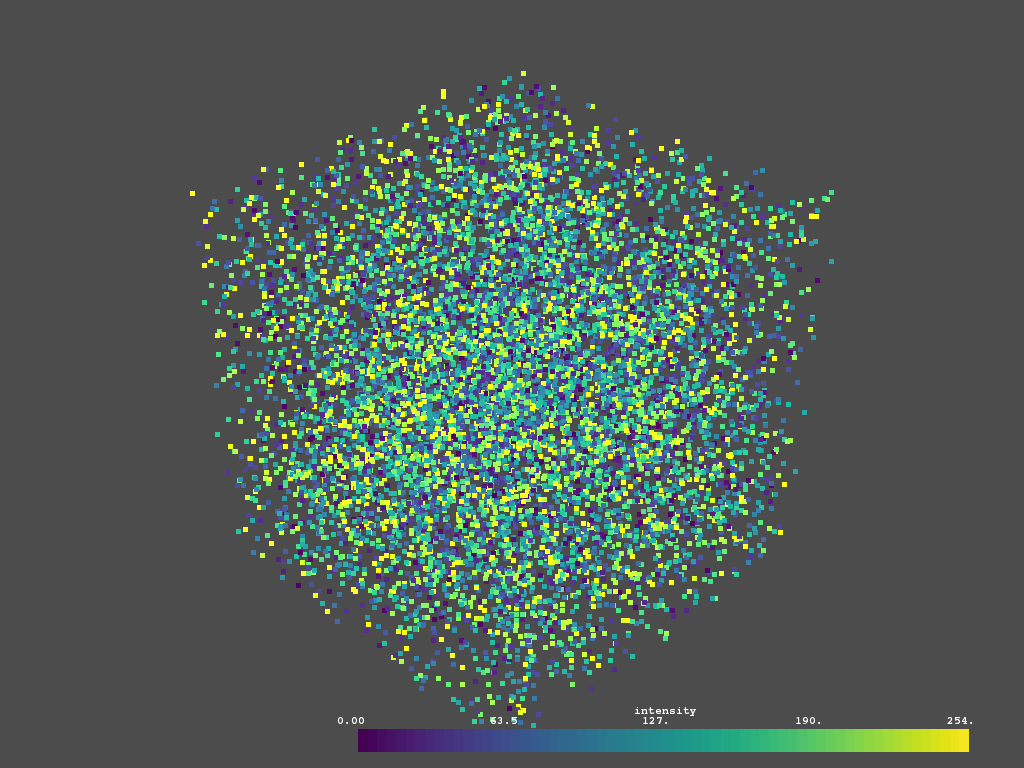
---
### Author:  [@ral](https://discourse.vtk.org/u/ral)
#### Post date: [March 3, 2019, 3:04am UTC](https://discourse.vtk.org/t/how-to-add-intensity-value-at-every-point-in-a-point-cloud-using-vtk-i-am-using-python/349/5 "2019-03-03T03:04:07Z")
Thank you for your response, but I need to use vtk, and adding intensity to the points is just a step from the entire process
---
### Author:  [@banesullivan](https://discourse.vtk.org/u/banesullivan)
#### Post date: [March 3, 2019, 3:15am UTC](https://discourse.vtk.org/t/how-to-add-intensity-value-at-every-point-in-a-point-cloud-using-vtk-i-am-using-python/349/6 "2019-03-03T03:15:10Z")
> [@ral](#):
>
> but I need to use vtk
**`vtki` is VTK.** _It simply adds a layer on top to make VTK way easier to use_ so that we don’t have to remember the nuances of lookup tables and rendering, etc.
All `vtki` data objects are instances of VTK data objects:
```python
>>> import vtk
>>> import vtki
>>> isinstance(vtki.PolyData(), vtk.vtkPolyData)
True
>>> isinstance(vtki.UnstructuredGrid(), vtk.vtkUnstructuredGrid)
True
```
> [@ral](#):
>
> adding intensity to the points is just a step from the entire process
- You’ll need to create a mapper: `vtk.vtkDataSetMapper()`
- Then set up that mappers lookup table properly: `mapper.GetLookupTable()` and set its attributes/colormapping
Try following [this example](https://vtk.org/Wiki/VTK/Examples/Python/Widgets/ScalarBarWidget) or [this cpp exmaple which could be translated to Python](https://vtk.org/Wiki/VTK/Examples/Cxx/PolyData/ColoredPoints)