# Image Profile
**URL:** https://discourse.vtk.org/t/image-profile/9768
**Category:** Support
**Created:** [November 8, 2022, 2:20pm UTC](https://discourse.vtk.org/t/image-profile/9768 "2022-11-08T14:20:22Z")
**Posts on this page:** 7
**Page:** 1
### Author:  [@fvitello](https://discourse.vtk.org/u/fvitello)
#### Post date: [November 8, 2022, 2:20pm UTC](https://discourse.vtk.org/t/image-profile/9768/1 "2022-11-08T14:20:22Z")
Hi There,
I want to implement in my application the possibility to have an xy plot of the intensity values of an image along the X or the Y axis. I have tried to draw vtkLineSource on top of my image and extract the intensity values with vtkImageProbeFilter but this approach doesn’t work. Do you have Any suggestion on how to implement this?
---
### Author:  [@dgobbi](https://discourse.vtk.org/u/dgobbi)
#### Post date: [November 8, 2022, 2:55pm UTC](https://discourse.vtk.org/t/image-profile/9768/2 "2022-11-08T14:55:07Z")
It should definitely be possible to do this with either vtkImageProbeFilter or with vtkProbeFilter. Here’s a short checklist:
1. Make sure the line has enough points, e.g. SetResolution(100)
2. Make sure the Bounds of the line are within the Bounds of the image
For the latter, note that both vtkPolyData (the line) and vtkImageData (the image) have a GetBounds() method, so the bounds check should be easy to do.
Are you working with 3D images or 2D images? For 2D, the line points must lie within the plane of the image.
Once the intensity values are attached to the line, it should be possible to use vtkWarpScalar to turn the line into a profile that can be rendered on the image.
---
### Author:  [@fvitello](https://discourse.vtk.org/u/fvitello)
#### Post date: [November 8, 2022, 3:29pm UTC](https://discourse.vtk.org/t/image-profile/9768/3 "2022-11-08T15:29:45Z")
Dear David,
Thanks.
How many point the line should have? Same size of the image?
I have checked that the bounds of the line and the 2D mage are the same.
Following an extract of my code
```auto
vtkImageData* data = myfits->GetOutput();
double* range = data->GetPointData()->GetScalars()->GetRange();
double p0_x[3] = {1.0, world_coord[1], 1};
double p1_x[3] = {double(myfits->GetNaxes(0)), world_coord[1], 1};
vtkNew lineSource_x;
lineSource_x->SetPoint1(p0_x);
lineSource_x->SetPoint2(p1_x);
lineSource_x->SetResolution(100);
lineSource_x->Update();
vtkNew probe2;
probe2->SetInputConnection(lineSource_x->GetOutputPort());
probe2->SetSourceConnection(myfits->GetOutputPort());
probe2->Update();
```
Can you help me on the next steps to follow?
---
### Author:  [@dgobbi](https://discourse.vtk.org/u/dgobbi)
#### Post date: [November 8, 2022, 7:10pm UTC](https://discourse.vtk.org/t/image-profile/9768/4 "2022-11-08T19:10:40Z")
> [@](#):
>
> How many point the line should have? Same size of the image?
Yes, one point per image voxel will make a good profile. You can use `SetResolution(size-1)` to get the correct number of points. The resolution is the number of segments, which is one less than the number of points.
Is the _z_ coordinate of your image always 1, and not 0? To me, it seems strange that your coordinates start at 1 instead of 0, so I expected something like this:
```c++
double p0_x[3] = {0, world_coord[1], 0};
double p1_x[3] = {double(myfits->GetNaxes(0))-1, world_coord[1], 0};
```
As a next step, you can try putting the output of `probe2` into `vtkWarpScalar`, and then render the output of `vtkWarpScalar`. If everything works, it will look like a profile.
---
### Author:  [@fvitello](https://discourse.vtk.org/u/fvitello)
#### Post date: [November 9, 2022, 11:20am UTC](https://discourse.vtk.org/t/image-profile/9768/6 "2022-11-09T11:20:09Z")
Thanks,
I have added the following code
```auto
vtkNew warp;
warp->SetInputConnection(probe2->GetOutputPort());
vtkNew mapper;
mapper->SetInputConnection(warp->GetOutputPort());
mapper->SetScalarRange(0, 255);
vtkNew profile;
profile->SetMapper(mapper);
```
But the result is empty

If I use the following code
```auto
vtkSmartPointer profile = vtkSmartPointer::New();
profile->AddDataSetInputConnection(probe2->GetOutputPort());
profile->GetPositionCoordinate()->SetValue(0.05, 0.05, 0);
profile->GetPosition2Coordinate()->SetValue(0.95, 0.95, 0);
profile->SetXValuesToNormalizedArcLength();
```
The profile is not the one I expect
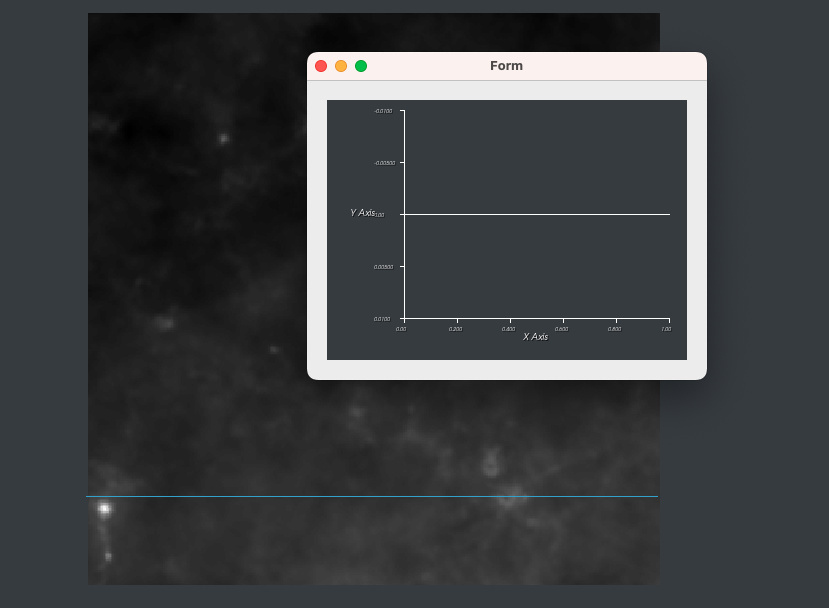
Thanks
---
### Author:  [@dgobbi](https://discourse.vtk.org/u/dgobbi)
#### Post date: [November 9, 2022, 1:47pm UTC](https://discourse.vtk.org/t/image-profile/9768/7 "2022-11-09T13:47:21Z")
I still suspect that your line is not placed correctly, and is therefore not within the image bounds. Have you checked the numerical values of the scalars that are produced by the probe filter?
Here is a small Python example that I wrote for image probing:
```python
import vtkmodules.all as vtk
source = vtk.vtkImageSinusoidSource()
source.SetDirection(1.0, 0.0, 0.0)
source.SetPeriod(100)
source.SetWholeExtent(0, 299, 0, 299, 0, 0)
source.SetAmplitude(1.0)
line = vtk.vtkLineSource()
line.SetPoint1(0.0, 100.0, 0.0)
line.SetPoint2(299.0, 100.0, 0.0)
line.SetResolution(299)
probe = vtk.vtkImageProbeFilter()
probe.SetSourceConnection(source.GetOutputPort())
probe.SetInputConnection(line.GetOutputPort())
probe.Update()
profile = probe.GetOutput().GetPointData().GetScalars()
n = profile.GetNumberOfValues()
print("Profile Data:")
for i in range(n):
print(profile.GetValue(i))
print("Image Bounds:")
source.Update()
print(source.GetOutput().GetBounds())
print("Line Bounds:")
line.Update()
print(line.GetOutput().GetBounds())
warp = vtk.vtkWarpScalar()
warp.SetInputConnection(probe.GetOutputPort())
warp.SetNormal(0.0, 1.0, 0.0)
warp.SetScaleFactor(150.0)
mapper = vtk.vtkDataSetMapper()
mapper.SetInputConnection(warp.GetOutputPort())
mapper.ScalarVisibilityOff()
actor = vtk.vtkActor()
actor.SetMapper(mapper)
actor.GetProperty().SetColor(1.0, 1.0, 0.0)
renderer = vtk.vtkRenderer()
renderer.AddViewProp(actor)
renwin = vtk.vtkRenderWindow()
renwin.AddRenderer(renderer)
iren = vtk.vtkRenderWindowInteractor()
renwin.SetInteractor(iren)
iren.Initialize()
iren.Start()
grab = vtk.vtkWindowToImageFilter()
grab.SetInput(renwin)
grab.Update()
writer = vtk.vtkPNGWriter()
writer.SetInputData(grab.GetOutput())
writer.SetFileName("profile.png")
writer.Write()
```
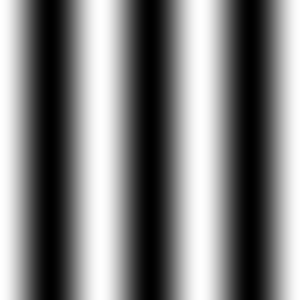
It produces the following profile:
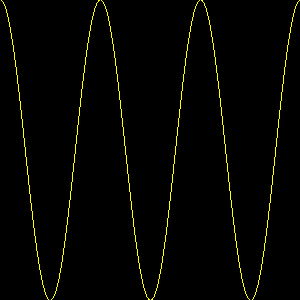
from the following image:
---
### Author:  [@fvitello](https://discourse.vtk.org/u/fvitello)
#### Post date: [November 9, 2022, 5:18pm UTC](https://discourse.vtk.org/t/image-profile/9768/8 "2022-11-09T17:18:36Z")
Thanks. I am now able to plot the profile. The issue was solved passing my data to the probe filter in the following way:
```auto
probe_y->SetSourceData(myfits->GetOutput());
```