# INTERPOLATE ON STL: Plotting scalar field on 50 points on An 70000-points STL surface
**URL:** https://discourse.vtk.org/t/interpolate-on-stl-plotting-scalar-field-on-50-points-on-an-70000-points-stl-surface/450
**Category:** Support
**Created:** [March 11, 2019, 5:25pm UTC](https://discourse.vtk.org/t/interpolate-on-stl-plotting-scalar-field-on-50-points-on-an-70000-points-stl-surface/450 "2019-03-11T17:25:02Z")
**Posts on this page:** 20
**Page:** 1
### Author:  [@Hosam](https://discourse.vtk.org/u/Hosam)
#### Post date: [March 11, 2019, 5:25pm UTC](https://discourse.vtk.org/t/interpolate-on-stl-plotting-scalar-field-on-50-points-on-an-70000-points-stl-surface/450/1 "2019-03-11T17:25:02Z")
Hello,
I have an STL surface file. The data were sampled on 50 selected points only
(wind tunnel test).
I want to visualize the field as a contour on the STL file.
I know basic stuff on how to use VTK python library. But this task I want it
involves:
- interpolating the field inside the probes-area
- extrapolating outside the probes-area
- then creating the final VTK file.
- maybe triangulation is also needed…
OR, there might be a crazy filter in paraview that can do the whole thing!
Any help would be appreciated…
---
### Author:  [@banesullivan](https://discourse.vtk.org/u/banesullivan)
#### Post date: [March 12, 2019, 5:28am UTC](https://discourse.vtk.org/t/interpolate-on-stl-plotting-scalar-field-on-50-points-on-an-70000-points-stl-surface/450/2 "2019-03-12T05:28:36Z")
Can you share the file?
Perhaps the [`vtki` Python package](http://docs.vtki.org) would be a goodd place to start:
```python
import vtki
data = vtki.read(‘my_file.stl’)
tri = data.tri_filter()
contours = tri.contour()
contours.plot()
contours.save(‘my_new_output.vtk’)
```
---
### Author:  [@Hosam](https://discourse.vtk.org/u/Hosam)
#### Post date: [March 12, 2019, 2:06pm UTC](https://discourse.vtk.org/t/interpolate-on-stl-plotting-scalar-field-on-50-points-on-an-70000-points-stl-surface/450/3 "2019-03-12T14:06:07Z")
Hello Bane,
Thank you very much for your reply. I could not attach the files (new user) but here is a dropbox link:
> **[InterpolatingOnSTL.zip](https://www.dropbox.com/s/xdusaasn86t1q8e/InterpolatingOnSTL.zip?dl=0)**
>
> Shared with Dropbox
You will find an STL file (mesh only) and a txt file that contains the coordinates of the points and the value of the field at each point: [x, y, z, val].
What I need is to interpolate this field on the STL and visualize it as a VTK on paraview.
The script you shared does not interpolate the field I have on the STL, does it?
Thanks,
---
### Author:  [@banesullivan](https://discourse.vtk.org/u/banesullivan)
#### Post date: [March 12, 2019, 6:43pm UTC](https://discourse.vtk.org/t/interpolate-on-stl-plotting-scalar-field-on-50-points-on-an-70000-points-stl-surface/450/4 "2019-03-12T18:43:42Z")
There are a lot of different ways you could resample/interpolate your sparse points onto your surface. Here are a few using `numpy`, `scipy` and `vtki` but you probably want to check out libraries that implement [kriging](https://en.wikipedia.org/wiki/Kriging).
```python
import vtki
import numpy as np
# Load STL file
surface = vtki.read('InterpolatingOnSTL_final.stl')
# Load numpy file
foo = np.loadtxt('points.txt', skiprows=1, delimiter='\t')
lookup = vtki.PolyData(foo[:, 0:3])
lookup.point_arrays['val'] = foo[:,3]
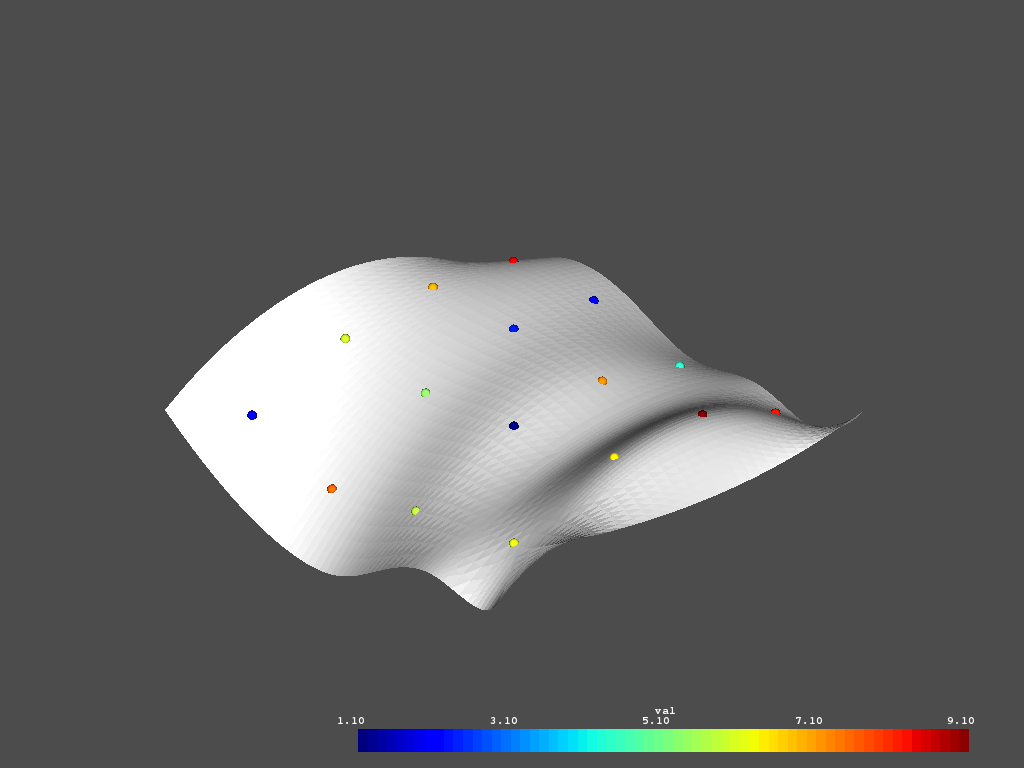
# Inspect the given data
p = vtki.Plotter()
p.add_mesh(surface)
p.add_mesh(lookup, render_points_as_spheres=True, point_size=10)
p.show()
```
```python
# Use scipy to run interpolation
from scipy.interpolate import griddata
method = 'linear'
surface.point_arrays[method] = griddata(
lookup.points, lookup.point_arrays['val'],
surface.points, method=method)
method = 'nearest'
surface.point_arrays[method] = griddata(
lookup.points, lookup.point_arrays['val'],
surface.points, method=method)
# Assisted linear
assisted = surface.point_arrays['linear'].copy()
badi = np.argwhere(np.isnan(assisted))
assisted[badi] = surface.point_arrays['nearest'][badi]
surface.point_arrays['assisted linear'] = assisted
```
```python
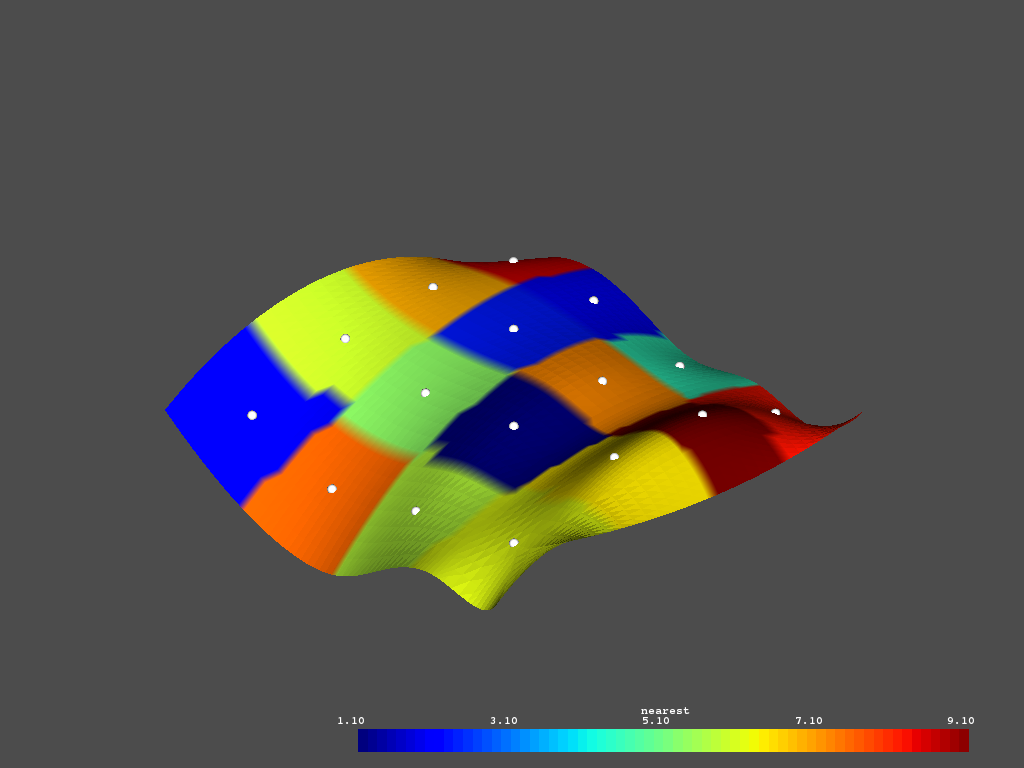
# Plot the nearest neighbor interpolated data
p = vtki.Plotter()
p.add_mesh(surface, scalars='nearest')
p.add_mesh(lookup, render_points_as_spheres=True,
point_size=10, color='w')
p.show()
```
```python
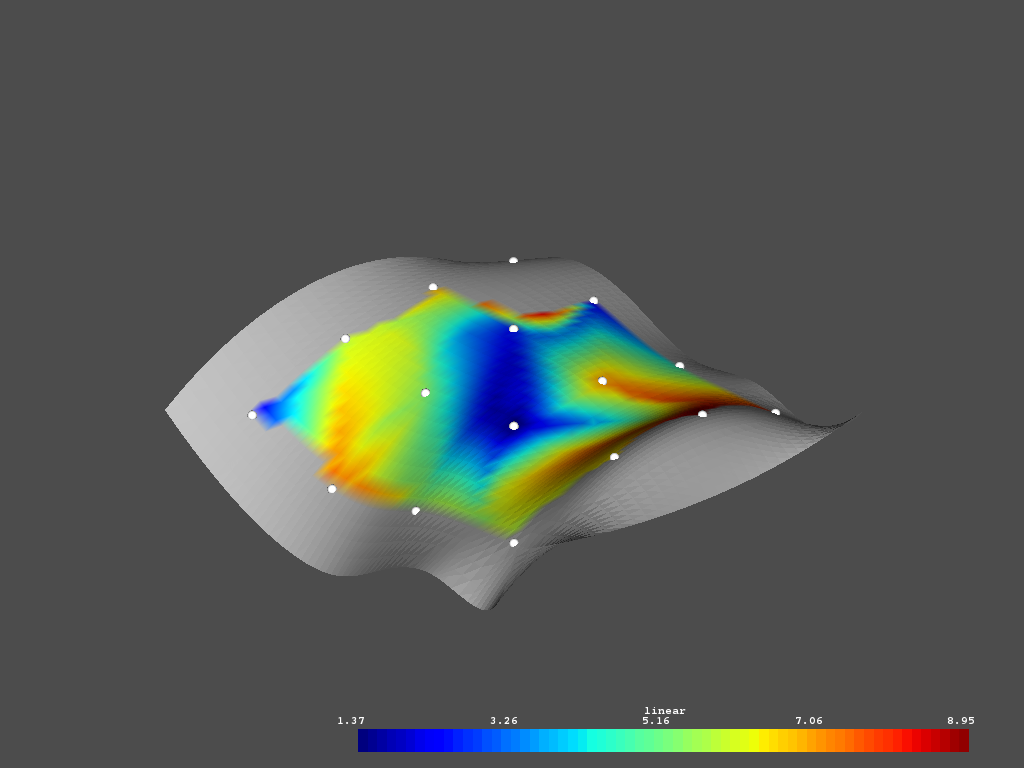
# Plot the linear interpolated data
p = vtki.Plotter()
p.add_mesh(surface, scalars='linear')
p.add_mesh(lookup, render_points_as_spheres=True,
point_size=10, color='w')
p.show()
```
```python
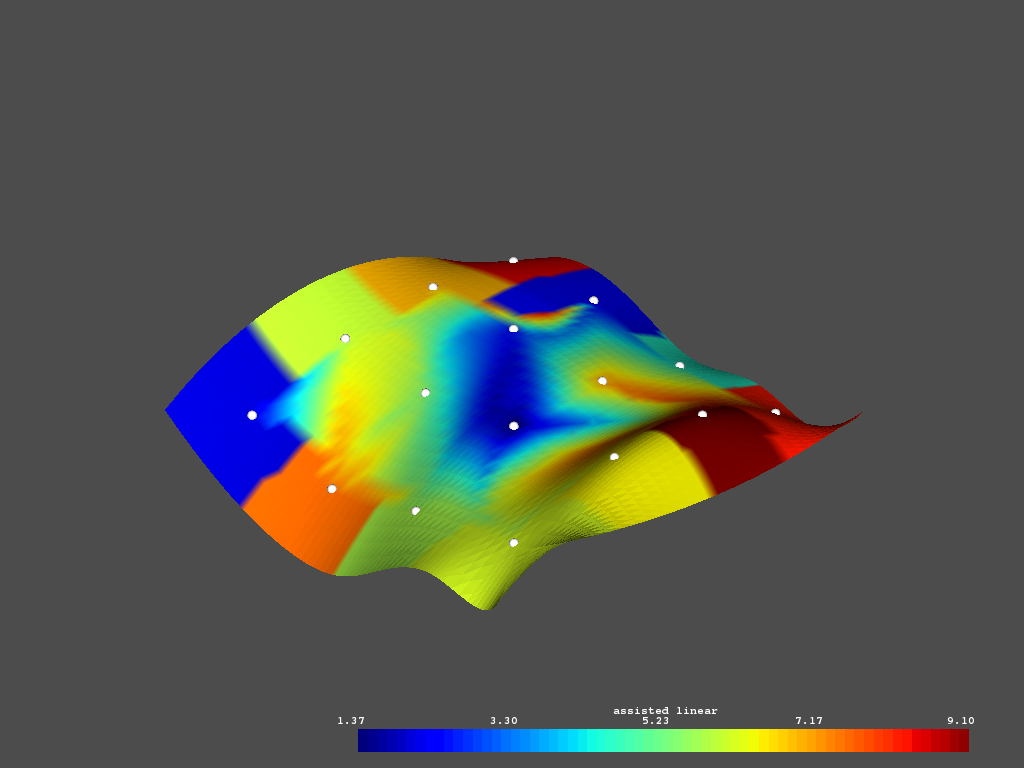
# Plot the assisted linear interpolated data
p = vtki.Plotter()
p.add_mesh(surface, scalars='assisted linear')
p.add_mesh(lookup, render_points_as_spheres=True,
point_size=10, color='w')
p.show()
```
---
### Author:  [@banesullivan](https://discourse.vtk.org/u/banesullivan)
#### Post date: [March 12, 2019, 6:49pm UTC](https://discourse.vtk.org/t/interpolate-on-stl-plotting-scalar-field-on-50-points-on-an-70000-points-stl-surface/450/5 "2019-03-12T18:49:28Z")
These toolsets looks promising:
- [https://github.com/bsmurphy/PyKrige](https://github.com/bsmurphy/PyKrige)
- [http://pykriging.com](http://pykriging.com)
---
### Author:  [@Kenichiro-Yoshimi](https://discourse.vtk.org/u/Kenichiro-Yoshimi)
#### Post date: [March 13, 2019, 4:58am UTC](https://discourse.vtk.org/t/interpolate-on-stl-plotting-scalar-field-on-50-points-on-an-70000-points-stl-surface/450/6 "2019-03-13T04:58:44Z")
The vtkPointInterpolator with a Gaussian Kernel (or other kernel) is an alternative method to interpolate and extrapolate a bit more smoothly.
```python
import vtk
import numpy as np
points_reader = vtk.vtkDelimitedTextReader()
points_reader.SetFileName('points.txt')
points_reader.DetectNumericColumnsOn()
points_reader.SetFieldDelimiterCharacters('\t')
points_reader.SetHaveHeaders(True)
table_points = vtk.vtkTableToPolyData()
table_points.SetInputConnection(points_reader.GetOutputPort())
table_points.SetXColumn('x')
table_points.SetYColumn('y')
table_points.SetZColumn('z')
table_points.Update()
points = table_points.GetOutput()
points.GetPointData().SetActiveScalars('val')
range = points.GetPointData().GetScalars().GetRange()
# Read a probe surface
stl_reader = vtk.vtkSTLReader()
stl_reader.SetFileName('InterpolatingOnSTL_final.stl')
stl_reader.Update()
surface = stl_reader.GetOutput()
bounds = np.array(surface.GetBounds())
dims = np.array([101, 101, 101])
box = vtk.vtkImageData()
box.SetDimensions(dims)
box.SetSpacing((bounds[1::2] - bounds[:-1:2])/(dims - 1))
box.SetOrigin(bounds[::2])
# Gaussian kernel
gaussian_kernel = vtk.vtkGaussianKernel()
gaussian_kernel.SetSharpness(2)
gaussian_kernel.SetRadius(12)
interpolator = vtk.vtkPointInterpolator()
interpolator.SetInputData(box)
interpolator.SetSourceData(points)
interpolator.SetKernel(gaussian_kernel)
resample = vtk.vtkResampleWithDataSet()
resample.SetInputData(surface)
resample.SetSourceConnection(interpolator.GetOutputPort())
mapper = vtk.vtkPolyDataMapper()
mapper.SetInputConnection(resample.GetOutputPort())
mapper.SetScalarRange(range)
actor = vtk.vtkActor()
actor.SetMapper(mapper)
point_mapper = vtk.vtkPointGaussianMapper()
point_mapper.SetInputData(points)
point_mapper.SetScalarRange(range)
point_mapper.SetScaleFactor(0.6)
point_mapper.EmissiveOff();
point_mapper.SetSplatShaderCode(
"//VTK::Color::Impl\n"
"float dist = dot(offsetVCVSOutput.xy,offsetVCVSOutput.xy);\n"
"if (dist > 1.0) {\n"
" discard;\n"
"} else {\n"
" float scale = (1.0 - dist);\n"
" ambientColor *= scale;\n"
" diffuseColor *= scale;\n"
"}\n"
)
point_actor = vtk.vtkActor()
point_actor.SetMapper(point_mapper)
renderer = vtk.vtkRenderer()
renWin = vtk.vtkRenderWindow()
renWin.AddRenderer(renderer)
iren = vtk.vtkRenderWindowInteractor()
iren.SetRenderWindow(renWin)
renderer.AddActor(actor)
renderer.AddActor(point_actor)
iren.Initialize()
renWin.Render()
iren.Start()
```
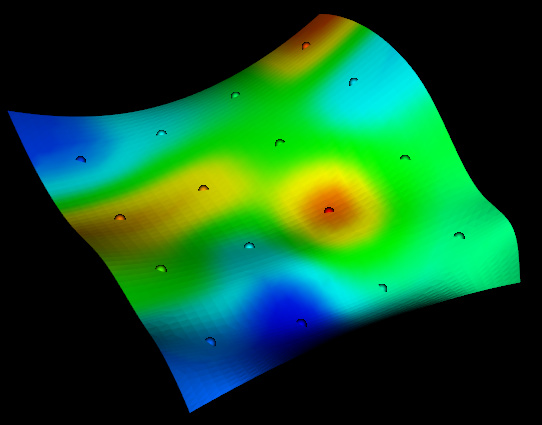
---
### Author:  [@Hosam](https://discourse.vtk.org/u/Hosam)
#### Post date: [March 13, 2019, 9:25am UTC](https://discourse.vtk.org/t/interpolate-on-stl-plotting-scalar-field-on-50-points-on-an-70000-points-stl-surface/450/7 "2019-03-13T09:25:13Z")
Bane & Kenichiro,
Wow, thank you very much for the quick amazing solutions to this. Exactly what I needed!
Thank you very much!
Hosam
---
### Author:  [@lorensen](https://discourse.vtk.org/u/lorensen)
#### Post date: [March 13, 2019, 9:39pm UTC](https://discourse.vtk.org/t/interpolate-on-stl-plotting-scalar-field-on-50-points-on-an-70000-points-stl-surface/450/8 "2019-03-13T21:39:29Z")
@Kenichiro-Yoshimi
Would you mind if I include a C++ version of your excellent solution in the VTKExamples Project ([https://lorensen.github.io/VTKExamples/site/](https://lorensen.github.io/VTKExamples/site/)).
@amaclean Perhaps you can add the python version if Kenichiro gives us permission.
@Hosam
Can I add your data to the VTKExamples Project?
Bill
---
### Author:  [@amaclean](https://discourse.vtk.org/u/amaclean)
#### Post date: [March 13, 2019, 9:52pm UTC](https://discourse.vtk.org/t/interpolate-on-stl-plotting-scalar-field-on-50-points-on-an-70000-points-stl-surface/450/9 "2019-03-13T21:52:01Z")
Bill, I would love to add it.
---
### Author:  [@Kenichiro-Yoshimi](https://discourse.vtk.org/u/Kenichiro-Yoshimi)
#### Post date: [March 14, 2019, 5:06am UTC](https://discourse.vtk.org/t/interpolate-on-stl-plotting-scalar-field-on-50-points-on-an-70000-points-stl-surface/450/10 "2019-03-14T05:06:52Z")
@lorensen
I submitted a pull request to add C++ example based on this code.
---
### Author:  [@Hosam](https://discourse.vtk.org/u/Hosam)
#### Post date: [March 14, 2019, 7:57am UTC](https://discourse.vtk.org/t/interpolate-on-stl-plotting-scalar-field-on-50-points-on-an-70000-points-stl-surface/450/11 "2019-03-14T07:57:48Z")
Yes of course you can use my example.
---
### Author:  [@Hosam](https://discourse.vtk.org/u/Hosam)
#### Post date: [March 14, 2019, 10:06am UTC](https://discourse.vtk.org/t/interpolate-on-stl-plotting-scalar-field-on-50-points-on-an-70000-points-stl-surface/450/12 "2019-03-14T10:06:04Z")
Hello Kenichiro,
Thank you very much again for solving my issue.
I have a couple of questions about the code.
Most importantly: how to save the result as a vtk to open it later in paraview?
Here is an example of the VTK files I am used to:
> **[example.vtk](https://www.dropbox.com/s/semifcuu0am3lku/example.vtk?dl=0)**
>
> Shared with Dropbox
Also:
- Why you have used 101 in the following:
dims = np.array([101, 101, 101])
- Also 2, 12 in:
gaussian\_kernel.SetSharpness(2)
gaussian\_kernel.SetRadius(12)
Could you please refer me to the reference where I can choose the type of interpolating kernel e.g. cubic,…etc.
- The choice of 0.6 in point\_mapper.SetScaleFactor(0.6)
- The choice of 1.0 in:
“if (dist \> 1.0) {\n”
" discard;\n
Thank you very much in advance!
---
### Author:  [@Hosam](https://discourse.vtk.org/u/Hosam)
#### Post date: [March 14, 2019, 10:15am UTC](https://discourse.vtk.org/t/interpolate-on-stl-plotting-scalar-field-on-50-points-on-an-70000-points-stl-surface/450/13 "2019-03-14T10:15:16Z")
Hello Bane,
Thank you very much for introducing this solution. I am interested also in the nearest neighbor interpolation to show the areas influenced directly by each probe.
Could you please show me how to save this results as a VTK file. Here is an example of the VTK files I am used to:
> **[example.vtk](https://www.dropbox.com/s/semifcuu0am3lku/example.vtk?dl=0)**
>
> Shared with Dropbox
Thank you!
Hosam
---
### Author:  [@Kenichiro-Yoshimi](https://discourse.vtk.org/u/Kenichiro-Yoshimi)
#### Post date: [March 14, 2019, 12:18pm UTC](https://discourse.vtk.org/t/interpolate-on-stl-plotting-scalar-field-on-50-points-on-an-70000-points-stl-surface/450/14 "2019-03-14T12:18:03Z")
Hello Hosam,
> [@Hosam](#):
>
> Most importantly: how to save the result as a vtk to open it later in paraview?
To save the result in legacy vtk format(\*.vtk), you can usually use the vtkDataSetWriter.
> [@Hosam](#):
>
> Why you have used 101 in the following:
> dims = np.array([101, 101, 101])
I previously interpolated point data on a surface through 3d image data, but it is really not necessary. So I rewrite the previous code exclusive of image data as below and you can ignore the corresponding part of vtkImageData.
> [@Hosam](#):
>
> Also 2, 12 in:
> gaussian\_kernel.SetSharpness(2)
> gaussian\_kernel.SetRadius(12)
Their values can be set as you prefer. Also there are really various interpolating kernels. See the links below and try:
[https://vtk.org/gitweb?p=VTK.git;a=blob;f=Filters/Points/Testing/Python/TestEllipsoidalGaussianKernel.py](https://vtk.org/gitweb?p=VTK.git;a=blob;f=Filters/Points/Testing/Python/TestEllipsoidalGaussianKernel.py)
[https://vtk.org/gitweb?p=VTK.git;a=blob;f=Filters/Points/Testing/Python/TestPointInterpolator.py](https://vtk.org/gitweb?p=VTK.git;a=blob;f=Filters/Points/Testing/Python/TestPointInterpolator.py)
```python
import vtk
points_reader = vtk.vtkDelimitedTextReader()
points_reader.SetFileName('points.txt')
points_reader.DetectNumericColumnsOn()
points_reader.SetFieldDelimiterCharacters('\t')
points_reader.SetHaveHeaders(True)
table_points = vtk.vtkTableToPolyData()
table_points.SetInputConnection(points_reader.GetOutputPort())
table_points.SetXColumn('x')
table_points.SetYColumn('y')
table_points.SetZColumn('z')
table_points.Update()
points = table_points.GetOutput()
points.GetPointData().SetActiveScalars('val')
range = points.GetPointData().GetScalars().GetRange()
# Read a probe surface
stl_reader = vtk.vtkSTLReader()
stl_reader.SetFileName('InterpolatingOnSTL_final.stl')
stl_reader.Update()
surface = stl_reader.GetOutput()
# Gaussian kernel
gaussian_kernel = vtk.vtkGaussianKernel()
gaussian_kernel.SetSharpness(2)
gaussian_kernel.SetRadius(12)
interpolator = vtk.vtkPointInterpolator()
interpolator.SetInputData(surface)
interpolator.SetSourceData(points)
interpolator.SetKernel(gaussian_kernel)
writer = vtk.vtkDataSetWriter()
writer.SetInputConnection(interpolator.GetOutputPort())
writer.SetFileName('interpolated.vtk')
writer.Write()
```
---
### Author:  [@banesullivan](https://discourse.vtk.org/u/banesullivan)
#### Post date: [March 14, 2019, 2:51pm UTC](https://discourse.vtk.org/t/interpolate-on-stl-plotting-scalar-field-on-50-points-on-an-70000-points-stl-surface/450/15 "2019-03-14T14:51:03Z")
@Hosam: `vtki` objects are instances of VTK objects, so you could save them in the same way you would save any VTK data object.
To make life a bit easier, we have added a `.save()` method on each of the objects:
```python
...
# after the code I shared in my previous post
surface.save('my-data.vtk')
```
Or you could pass that object to a VTK pipeline if you’re more familiar with that:
```python
...
# after the code I shared in my previous post
import vtk
writer = vtk.vtkDataSetWriter()
writer.SetInputDataObject(surface)
writer.SetFileName('my-data.vtk')
writer.Write()
```
---
### Author:  [@amaclean](https://discourse.vtk.org/u/amaclean)
#### Post date: [March 16, 2019, 10:57pm UTC](https://discourse.vtk.org/t/interpolate-on-stl-plotting-scalar-field-on-50-points-on-an-70000-points-stl-surface/450/16 "2019-03-16T22:57:46Z")
@Kenichiro-Yoshimi I have added your Python example to VTKExamples.
It will appear as [PointInterpolator](https://lorensen.github.io/VTKExamples/site/Python/Meshes/PointInterpolator/) when the web pages are updated.
cc: @lorensen
---
### Author:  [@Kenichiro-Yoshimi](https://discourse.vtk.org/u/Kenichiro-Yoshimi)
#### Post date: [March 17, 2019, 9:44am UTC](https://discourse.vtk.org/t/interpolate-on-stl-plotting-scalar-field-on-50-points-on-an-70000-points-stl-surface/450/17 "2019-03-17T09:44:11Z")
@amaclean
Thank you very much!
---
### Author:  [@adamjamesturner93](https://discourse.vtk.org/u/adamjamesturner93)
#### Post date: [April 28, 2020, 5:29pm UTC](https://discourse.vtk.org/t/interpolate-on-stl-plotting-scalar-field-on-50-points-on-an-70000-points-stl-surface/450/18 "2020-04-28T17:29:46Z")
Sorry to revitalise this thread!
Would anyone be able to help me port this to VTK.js? It is exactly what I’m looking for, but the vtk.js api is slightly different ☹
---
### Author:  [@mwestphal](https://discourse.vtk.org/u/mwestphal)
#### Post date: [April 29, 2020, 1:26am UTC](https://discourse.vtk.org/t/interpolate-on-stl-plotting-scalar-field-on-50-points-on-an-70000-points-stl-surface/450/19 "2020-04-29T01:26:46Z")
please open your own thread.
---
### Author:  [@mwestphal](https://discourse.vtk.org/u/mwestphal)
#### Post date: [April 29, 2020, 1:26am UTC](https://discourse.vtk.org/t/interpolate-on-stl-plotting-scalar-field-on-50-points-on-an-70000-points-stl-surface/450/20 "2020-04-29T01:26:48Z")