# make a contour from a set of points
**URL:** https://discourse.vtk.org/t/make-a-contour-from-a-set-of-points/10796
**Category:** Support
**Tags:** pyvista, python
**Created:** [February 25, 2023, 8:27am UTC](https://discourse.vtk.org/t/make-a-contour-from-a-set-of-points/10796 "2023-02-25T08:27:55Z")
**Posts on this page:** 2
**Page:** 1
### Author:  [@pravin\_poudel](https://discourse.vtk.org/u/pravin_poudel)
#### Post date: [February 25, 2023, 8:27am UTC](https://discourse.vtk.org/t/make-a-contour-from-a-set-of-points/10796/1 "2023-02-25T08:27:55Z")
Hi I am trying to implement from scratch (i.e., **without using any library functions for contouring or interpolation** ) an iso contour algorithm.
This is my code where i am using pyvista to plot
```auto
isovalue = 0.15
def f(x, y):
return np.sin(10*x)+np.cos(4*y)-np.cos(3*x*y)
x = np.arange(0, 1, 0.05)
y = np.arange(0, 1, 0.05)
XX, YY = np.meshgrid(x, y)
data = f(XX, YY)
def iso_contour(array, target_value):
contours = []
rows, cols = array.shape
# Loop through each cell in the array
for i in range(rows-1):
for j in range(cols-1):
cell_verts = []
# Check each corner of the cell
for corner in [(i,j), (i+1,j), (i+1,j+1), (i,j+1)]:
x, y = corner
cell_verts.append((x, y, array[x,y]))
# Check each edge of the cell
for k in range(4):
p1, p2 = cell_verts[k], cell_verts[(k+1)%4]
if (p1[2] >= target_value) != (p2[2] >= target_value):
# Calculate intersection point
t = (target_value - p1[2]) / (p2[2] - p1[2])
x, y = p1[:2] + t * (np.array(p2[:2]) - np.array(p1[:2]))
contours.append((y, x, 0.0))
return contours
contour_points = iso_contour(data, isovalue)
pl = pv.Plotter()
pl.add_mesh(grid, show_edges = True)
for i in range(len(contour_points)-1):
line = pv.Line(contour_points[i], contour_points[i+1])
pl.add_mesh(line, color='r', line_width=5)
pl.show()
```
I wanted to get the contour like this
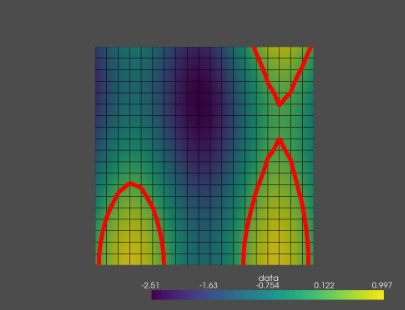
but i am getting
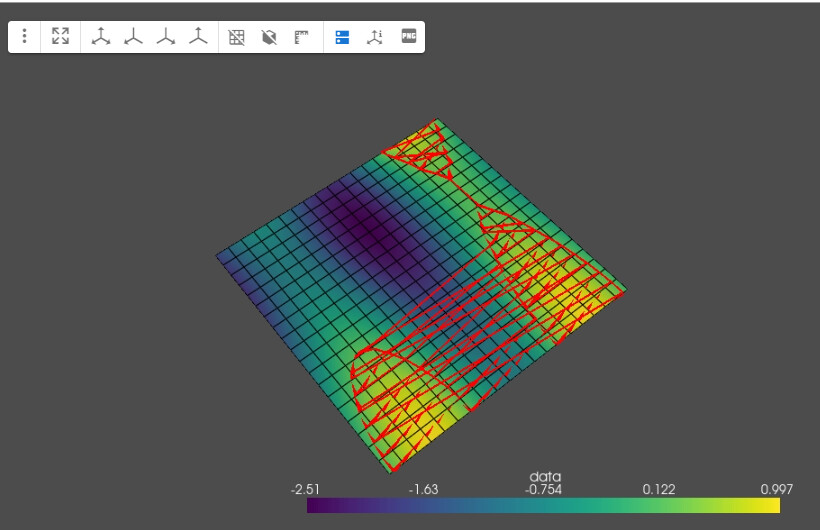
is there any filter or anything that i can use to make it like contour line !
Thank you !!
---
### Author:  [@marcomusy](https://discourse.vtk.org/u/marcomusy)
#### Post date: [February 27, 2023, 4:03pm UTC](https://discourse.vtk.org/t/make-a-contour-from-a-set-of-points/10796/2 "2023-02-27T16:03:45Z")
you’re looping twice on the same edges.
moreover you will not get lines from joining points which are scanned along x and y.