# plotting grid data on chart scene
**URL:** https://discourse.vtk.org/t/plotting-grid-data-on-chart-scene/8915
**Category:** Support
**Tags:** python
**Created:** [July 10, 2022, 12:21am UTC](https://discourse.vtk.org/t/plotting-grid-data-on-chart-scene/8915 "2022-07-10T00:21:20Z")
**Posts on this page:** 3
**Page:** 1
### Author:  [@Odera\_Dim](https://discourse.vtk.org/u/Odera_Dim)
#### Post date: [July 10, 2022, 12:21am UTC](https://discourse.vtk.org/t/plotting-grid-data-on-chart-scene/8915/1 "2022-07-10T00:21:20Z")
Hi all,
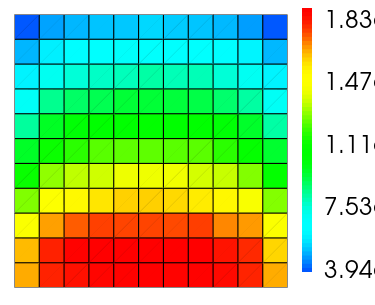
I am trying to plot some figures using the vtk bindings in python. My figure is a simple 10 x 10 square grid with colors for each cell of the grid being colored based on an array of 100 values. I was able to achieve this using vtkPlaneSource. However, when I resize the the rendered window, the legend, figure and title start to overlap each other and just ends up looking a mess. I saw an [example](https://kitware.github.io/vtk-examples/site/Python/Plotting/MultiplePlots/) which has the general behavior that I will like for my application but it was a chart plotting points. I would like to plot a grid data within the chart scene so that my figure retains the axes, legend, titles and also resizes properly. Here is a sample of that I was able to get so far. You can see the legend isn’t sitting right and would get even more poorly positioned when I resize. Thanks in advance
---
### Author:  [@amaclean](https://discourse.vtk.org/u/amaclean)
#### Post date: [July 11, 2022, 9:55pm UTC](https://discourse.vtk.org/t/plotting-grid-data-on-chart-scene/8915/2 "2022-07-11T21:55:13Z")
I think you can use two views with the legend in one view and the chart in another. Not sure if this helps: [PBR\_Skybox](https://kitware.github.io/vtk-examples/site/Cxx/Rendering/PBR_Skybox/). Also possibly a callback to control resizing.
---
### Author:  [@Odera\_Dim](https://discourse.vtk.org/u/Odera_Dim)
#### Post date: [July 12, 2022, 4:12pm UTC](https://discourse.vtk.org/t/plotting-grid-data-on-chart-scene/8915/3 "2022-07-12T16:12:01Z")
Thanks so much for your suggestion. I looked at the example you suggested and the challenge I am having is that already my plot already had 4 viewports in which figures similar to the one I shared in the initial post are rendered. Based on your suggestion I will probably need to write a function that breaks up each viewport into two sub-viewports. This will result in a total of 8. This may actually work but I would have preferred something like an overlay of a widget which is responsive and will not overlap the plot on resize. Your suggestion is definitely very logical, however, I am thinking that there might be a cleaner and easier way to do this task. Thank you so much.