# Plotting Toolpath of 3D Printer as Arrows in VTK
**URL:** https://discourse.vtk.org/t/plotting-toolpath-of-3d-printer-as-arrows-in-vtk/6928
**Category:** Support
**Created:** [October 21, 2021, 2:51pm UTC](https://discourse.vtk.org/t/plotting-toolpath-of-3d-printer-as-arrows-in-vtk/6928 "2021-10-21T14:51:25Z")
**Posts on this page:** 4
**Page:** 1
### Author:  [@BastianJuelich](https://discourse.vtk.org/u/BastianJuelich)
#### Post date: [October 21, 2021, 2:51pm UTC](https://discourse.vtk.org/t/plotting-toolpath-of-3d-printer-as-arrows-in-vtk/6928/1 "2021-10-21T14:51:25Z")
Hey,
as i am currently working on visualizing the “Toolpath” for a 3d printing machine i am interested if this is possible with vtk (pretty sure it is…)
So the Data i have is in a .cli File ([COMMON LAYER INTERFACE (CLI)](https://www.hmilch.net/downloads/cli_format.html)).
I have a python script, which extracts the important information out of this cli file.
what i have as DataFrame object is the following:
partID z x1 y1 x2 y2
0 0 0.06 -30.073443 -21.202196 -30.086403 -21.220032
1 0 0.06 -30.014813 -21.291629 -29.992539 -21.260965
2 0 0.06 -29.911639 -21.319751 -29.943213 -21.363209
3 0 0.06 -29.871622 -21.434806 -29.830735 -21.378523
4 0 0.06 -29.749834 -21.437311 -29.800023 -21.506386
The partID doesnt matter here.
The information is basicly showing the so called Layer (or build-height in mm) as z-value, and the start (x1, y1) and endpoint (x2, y2) of the Laser path (The Scanning Vector of the Laser Toolpath) in a building space.
What i Like to View is something Like an Arrow or quiver plot for each Layer (for same z-values), a bit like this one shown here, but for a whole build part from z=0 to z=max in 3D
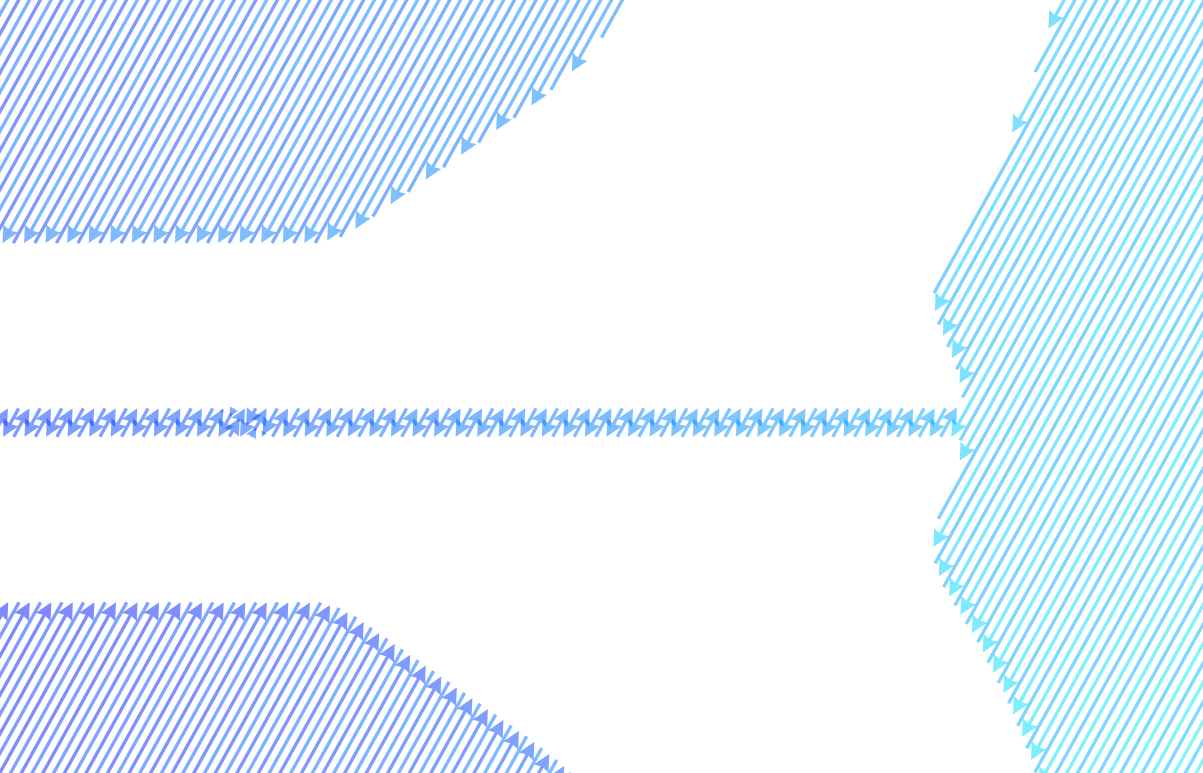
Any hints how to start?
Thx and BR
---
### Author:  [@marcomusy](https://discourse.vtk.org/u/marcomusy)
#### Post date: [October 23, 2021, 11:00am UTC](https://discourse.vtk.org/t/plotting-toolpath-of-3d-printer-as-arrows-in-vtk/6928/2 "2021-10-23T11:00:52Z")
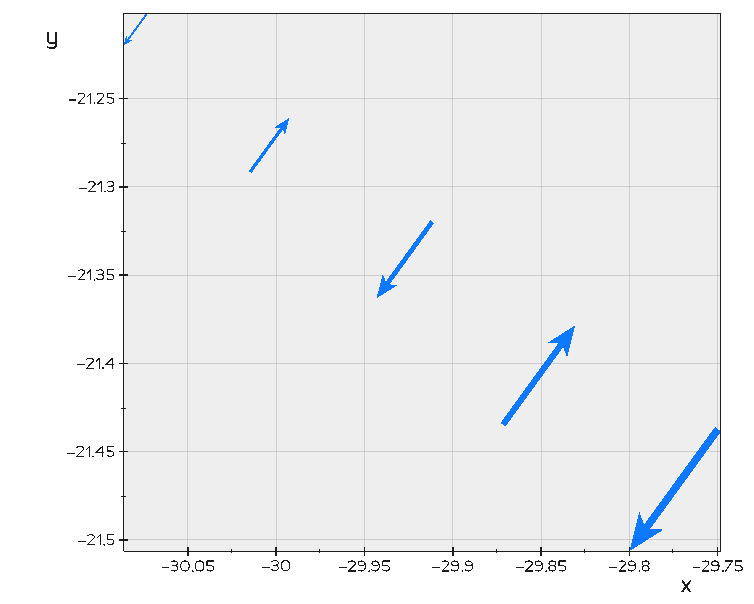
what about:
```python
from vedo import Arrow2D, show
data = [
[0, 0, 0.06, -30.073443, -21.202196, -30.086403, -21.220032],
[1, 0, 0.06, -30.014813, -21.291629, -29.992539, -21.260965],
[2, 0, 0.06, -29.911639, -21.319751, -29.943213, -21.363209],
[3, 0, 0.06, -29.871622, -21.434806, -29.830735, -21.378523],
[4, 0, 0.06, -29.749834, -21.437311, -29.800023, -21.506386],
]
arrs = [Arrow2D(d[3:5], d[5:7]).z(d[2]).c("blue5") for d in data]
show(arrs, axes=1)
```
---
### Author:  [@BastianJuelich](https://discourse.vtk.org/u/BastianJuelich)
#### Post date: [October 27, 2021, 7:33pm UTC](https://discourse.vtk.org/t/plotting-toolpath-of-3d-printer-as-arrows-in-vtk/6928/3 "2021-10-27T19:33:26Z")
Hey Marco,
thanks for your answer! But what i am looking for is doing exacly what you showed, just with pure vtk. The reason is a have build a Qt Application that allready uses vtk, so i dont want to go for other libraries.
But i think i will check the implementation of Arrow2D in vedo, maybe this will point me to the right direction!
Best regards
---
### Author:  [@marcomusy](https://discourse.vtk.org/u/marcomusy)
#### Post date: [October 27, 2021, 7:38pm UTC](https://discourse.vtk.org/t/plotting-toolpath-of-3d-printer-as-arrows-in-vtk/6928/4 "2021-10-27T19:38:11Z")
Sure - just grab the implementation from `vedo.shapes.Arrow2D` if you like it.