# Questions about the Point Cloud Data representation.
**URL:** https://discourse.vtk.org/t/questions-about-the-point-cloud-data-representation/969
**Category:** Support
**Created:** [May 15, 2019, 10:39am UTC](https://discourse.vtk.org/t/questions-about-the-point-cloud-data-representation/969 "2019-05-15T10:39:42Z")
**Posts on this page:** 7
**Page:** 1
### Author:  [@Kim\_William](https://discourse.vtk.org/u/Kim_William)
#### Post date: [May 15, 2019, 10:39am UTC](https://discourse.vtk.org/t/questions-about-the-point-cloud-data-representation/969/1 "2019-05-15T10:39:42Z")
Hi all!
I have some questions about Point Cloud Data.
Question 1)
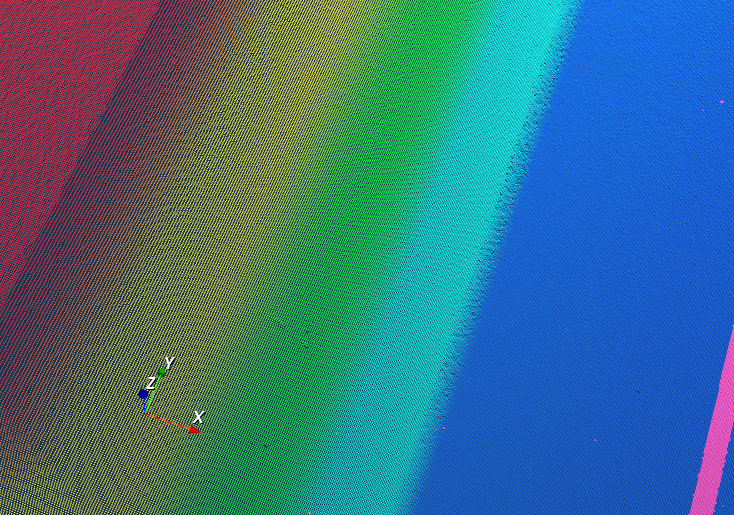
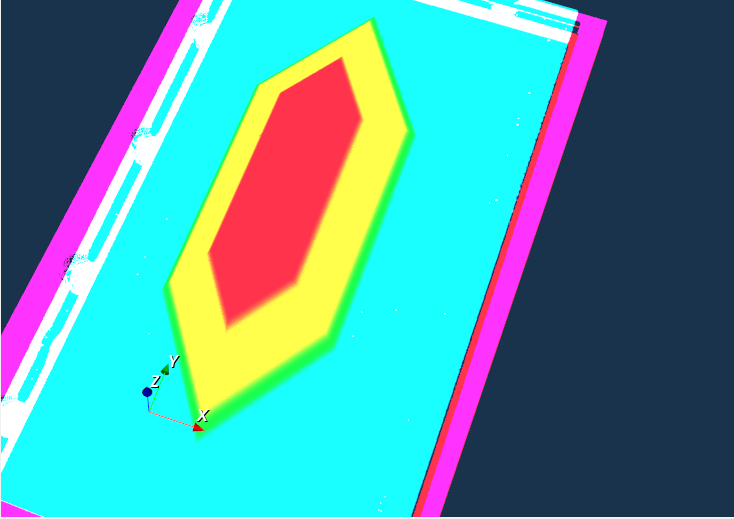
The colors are represented differently depending on zoom(In my code).
(zoom in)
(zoom out)
But ParaView shows the same color regardless of zoom.
(The below image is shown applied the Jet colormap.)
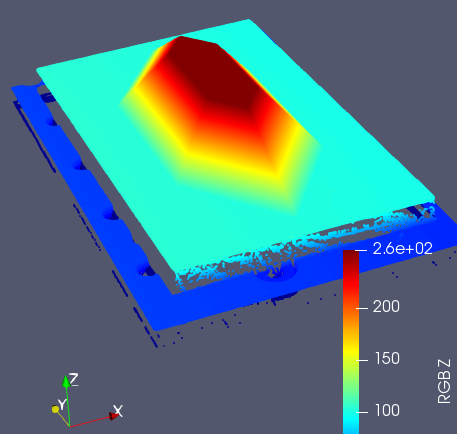
How to show the same color regardless of zoom?
Question 2)
When I dragging the point cloud data, the surface is shiny.
But ParaView, the surface is not shiny.
How to disable the shiny option on the code?
Could you please advise me? 😢
Thank you 🙂
---
### Author:  [@banesullivan](https://discourse.vtk.org/u/banesullivan)
#### Post date: [May 15, 2019, 6:32pm UTC](https://discourse.vtk.org/t/questions-about-the-point-cloud-data-representation/969/2 "2019-05-15T18:32:23Z")
Could you attach a data file of this data here for us to try out?
Looks like aliasing to me, but I’d be happy to give it a go with your data
---
### Author:  [@Kim\_William](https://discourse.vtk.org/u/Kim_William)
#### Post date: [May 15, 2019, 11:49pm UTC](https://discourse.vtk.org/t/questions-about-the-point-cloud-data-representation/969/3 "2019-05-15T23:49:17Z")
Hi Bane Sullivan.
I attached my PLY file.
> **[myPLY.zip](https://www.dropbox.com/s/ayp7xj27imkaqxd/myPLY.zip?dl=0)**
>
> Shared with Dropbox
Please help me 😢
---
### Author:  [@banesullivan](https://discourse.vtk.org/u/banesullivan)
#### Post date: [May 16, 2019, 6:28pm UTC](https://discourse.vtk.org/t/questions-about-the-point-cloud-data-representation/969/4 "2019-05-16T18:28:30Z")
### Question 1
> [@Kim\_William](#):
>
> Question 1)
> The colors are represented differently depending on zoom(In my code).
> (zoom in)
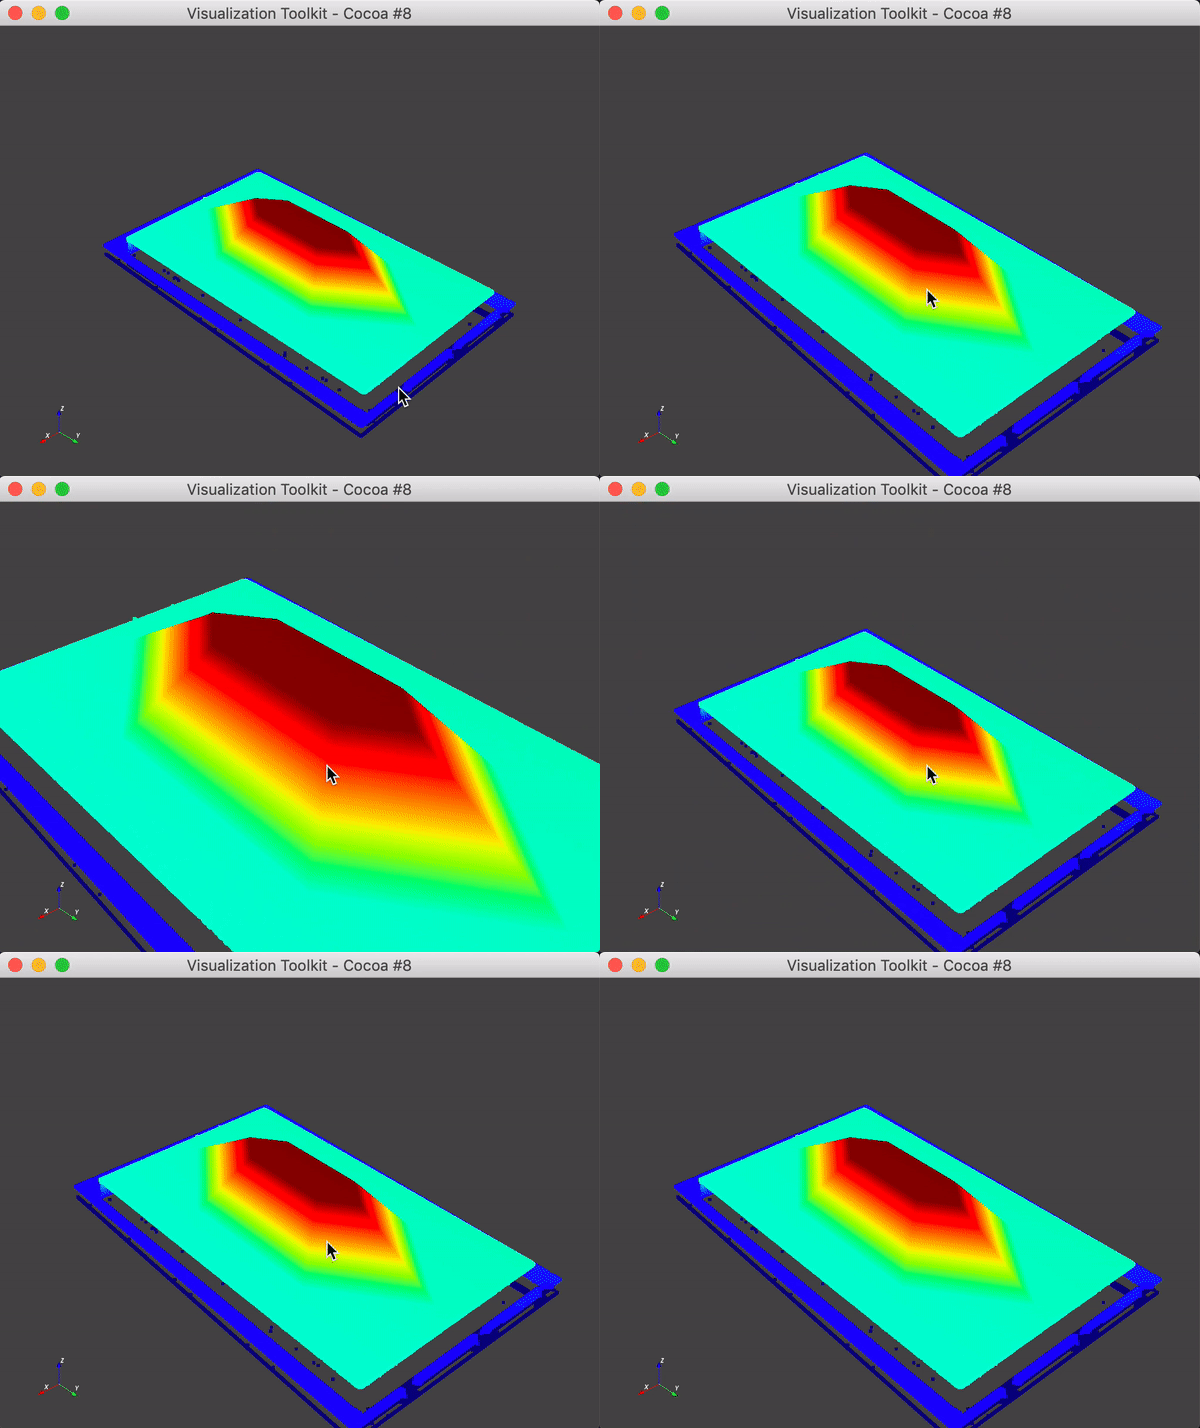
I can’t reproduce this issue - Using [PyVista](http://docs.pyvista.org), the colors are the same regardless of zoom level - I have no idea why your code would do this.
```py
import pyvista as pv
import numpy as np
# Re cast PolyData because file was not properly saved
bad = pv.read('myPLY.ply')
mesh = pv.PolyData(bad.points)
# Plot it
scalars = bad['RGB']
mesh.plot(scalars=scalars)
```
### Question 2
> [@Kim\_William](#):
>
> Question 2)
> When I dragging the point cloud data, the surface is shiny.
> But ParaView, the surface is not shiny.
>
> How to disable the shiny option on the code?
This likely has to do with the lighting set on your actor’s property: `actor.GetProperty().LightingOn()`. also, are you filtering this point cloud to a surface via a Delaunay filter or anything? Or are you keeping it a Points Representation?
I can’t say much more without seeing screenshots/your code.
### Additionally
Another point - you have RGB values for this mesh - perhaps turn off the scalar mapping and just use the RGB values for coloring your mesh. This is streamlined in PyVista as:
```py
mesh.plot(scalars=scalars, rgb=True)
```
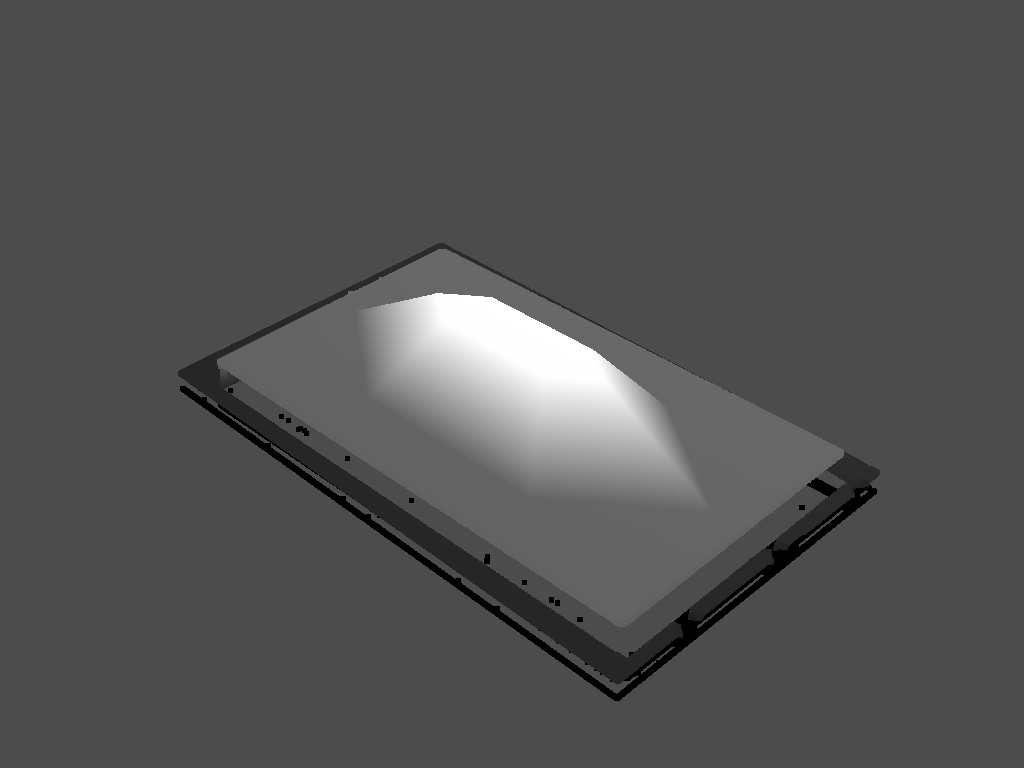
---
### Author:  [@Kim\_William](https://discourse.vtk.org/u/Kim_William)
#### Post date: [May 17, 2019, 12:46am UTC](https://discourse.vtk.org/t/questions-about-the-point-cloud-data-representation/969/5 "2019-05-17T00:46:50Z")
Hi Bane!
Thank you for your reply 🙂
My environment is as below:
IDE: Visual Studio 2015 MFC
VTK: ver 8.9
And my test code is:
```
vtkSmartPointer pPLYReader =
vtkSmartPointer::New();
pPLYReader->SetFileName(path);
pPLYReader->Update();
int numPts = pPLYReader->GetOutput()->GetPoints()->GetNumberOfPoints();
double bounds[6];
pPLYReader->GetOutput()->GetBounds(bounds);
// Find min and max z
double minz = bounds[4];
double maxz = bounds[5];
vtkSmartPointer lut =
vtkSmartPointer::New();
lut->SetTableRange(minz, maxz);
//lut->SetHueRange(0.0, 0.667);
lut->SetHueRange(1.0, 0.0);
lut->SetNumberOfColors(numPts);
lut->SetScaleToLinear();
lut->SetAlphaRange(0.0, 0.0);
lut->Build();
vtkSmartPointer colors =
vtkSmartPointer::New();
colors->SetNumberOfComponents(3);
colors->SetName("Colors");
for (int i = 0; i < numPts; i++)
{
double p[3];
pPLYReader->GetOutput()->GetPoint(i, p);
double dcolor[3];
lut->GetColor(p[2], dcolor);
unsigned char color[3];
for (unsigned int j = 0; j < 3; j++)
{
color[j] = static_cast(255.0 * dcolor[j]);
}
colors->InsertNextTypedTuple(color);
}
vtkSmartPointer pPolyData = pPLYReader->GetOutput();
pPolyData->GetPointData()->SetScalars(colors);
vtkSmartPointer mapper =
vtkSmartPointer::New();
mapper->SetInputConnection(pPLYReader->GetOutputPort());
mapper->SetScaleFactor(0);
vtkSmartPointer actor =
vtkSmartPointer::New();
actor->SetMapper(mapper);
actor->GetProperty()->SetOpacity(1.0);
vtkSmartPointer renderer =
vtkSmartPointer::New();
renderer->AddActor(actor);
renderer->SetBackground(.1, .2, .3);
renderer->ResetCamera();
m_vtkRenderWindow->AddRenderer(renderer);
m_vtkRenderWindow->Render();
renderer->ResetCamera();
m_vtkRenderWindow->Render();
```
So… If you have any spare time, could you please check my code?
Actually, I don’t know that my code is correctly used.
Thank you 🙂
---
### Author:  [@Kim\_William](https://discourse.vtk.org/u/Kim_William)
#### Post date: [May 21, 2019, 10:58am UTC](https://discourse.vtk.org/t/questions-about-the-point-cloud-data-representation/969/6 "2019-05-21T10:58:05Z")
Hi all.
I found to disable the shiny option.
If the ‘SetEmissive’ function is set to ‘false’, the shiny effect disappears.
```
...
vtkNew mapper;
mapper->SetEmissive(false);
...
```
---
### Author:  [@icecream1028](https://discourse.vtk.org/u/icecream1028)
#### Post date: [March 23, 2021, 2:35am UTC](https://discourse.vtk.org/t/questions-about-the-point-cloud-data-representation/969/7 "2021-03-23T02:35:34Z")
automation technology 3D camera calibration target?