# Resampling and ploting multiple slices from a vtkPolydata
**URL:** https://discourse.vtk.org/t/resampling-and-ploting-multiple-slices-from-a-vtkpolydata/10443
**Category:** Support
**Tags:** python
**Created:** [January 13, 2023, 12:45pm UTC](https://discourse.vtk.org/t/resampling-and-ploting-multiple-slices-from-a-vtkpolydata/10443 "2023-01-13T12:45:42Z")
**Posts on this page:** 6
**Page:** 1
### Author:  [@Jishnu](https://discourse.vtk.org/u/Jishnu)
#### Post date: [January 13, 2023, 12:45pm UTC](https://discourse.vtk.org/t/resampling-and-ploting-multiple-slices-from-a-vtkpolydata/10443/1 "2023-01-13T12:45:42Z")
I have a vtkPolydata with 3D coordinates of the vertex of the grid as points and Temperature at each point stored as point field data. I want to plot the Temperature distribution at different elevations. I am using Python for the operation. I have created a pipeline, and I am able to get the required slice from the vtkPolydata. However, when I rendered it, the plot looked like a scatter plot as shown below:
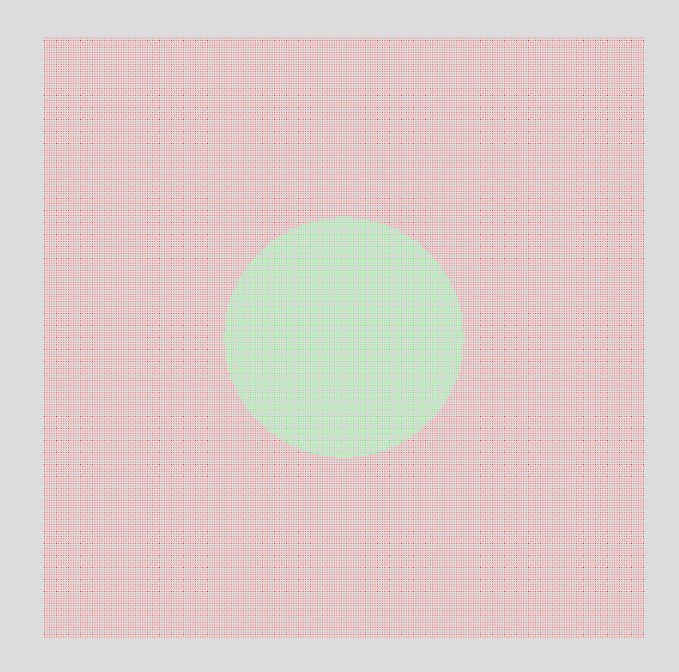
I want to plot it without any white space in between even when zoomed in. Please help me with this. I think I have to interpolate or create contours from the data, but I have no idea how to do it even after searching for a couple of days.
The code I used to generate the plot is given below.
The vtkPolydata I used to generate the above plot can be downloaded from here: [vtkPolydata](https://wetransfer.com/downloads/df54f405e4221331f37e6aa62d8544d020230113092905/aa8cf9)
```auto
import vtk
from vtk.util import numpy_support
import numpy as np
# Load vtkPolydata function
def loadvtp(fname):
reader = vtk.vtkXMLPolyDataReader()
reader.SetFileName(fname)
reader.Update()
data=reader.GetOutput()
return data
# Load vtkPolydata
polydata=loadvtp("TestPolydata.vtp")
# Set the elevation at which data need to be plotted
ele=12
# %% Clip polydata based on the elevation
# Create plane in +Z to cut the polydata below elevation
plane = vtk.vtkPlane()
plane.SetOrigin(0, 0, ele)
plane.SetNormal(0, 0, 1)
# create polydata clipper
clipper = vtk.vtkClipPolyData()
clipper.SetInputData(polydata)
clipper.SetClipFunction(plane)
clipper.Update()
out_data=clipper.GetOutput()
# Create plane in -Z to cut the polydata above elevation
plane = vtk.vtkPlane()
plane.SetOrigin(0, 0, ele+0.5)
plane.SetNormal(0, 0, -1)
clipper = vtk.vtkClipPolyData()
clipper.SetInputData(out_data)
clipper.SetClipFunction(plane)
clipper.Update()
# Cliped polydata
sampled_data=clipper.GetOutput()
# Get the "Temperature" Array from the polydata
point_scalars = sampled_data.GetPointData().GetArray("Temperature")
# Create a lookup table to map the point field data to colors
lut = vtk.vtkLookupTable()
lut.SetNumberOfTableValues(2)
lut.SetTableValue(0, 1, 0, 0, 1) # red
lut.SetTableValue(1, 0, 1, 0, 1) # green
lut.Build()
# Create a mapper and actor to display the cliped plane
mapper = vtk.vtkPolyDataMapper()
mapper.SetInputConnection(clipper.GetOutputPort())
mapper.SetScalarModeToUsePointFieldData()
mapper.ScalarVisibilityOn()
mapper.SetColorModeToMapScalars()
mapper.SelectColorArray(0)
mapper.SetLookupTable(lut)
mapper.SetScalarRange(point_scalars.GetRange())
actor = vtk.vtkActor()
actor.SetMapper(mapper)
# Create the RenderWindow, Renderer
colors = vtk.vtkNamedColors()
ren1 = vtk.vtkRenderer()
renWin = vtk.vtkRenderWindow()
renWin.AddRenderer(ren1)
iren = vtk.vtkRenderWindowInteractor()
iren.SetRenderWindow(renWin)
ren1.AddActor(actor)
ren1.SetBackground(colors.GetColor3d('Gainsboro'))
renWin.SetSize(650, 650)
renWin.SetWindowName('Test')
style = vtk.vtkInteractorStyleTrackballCamera()
iren.SetInteractorStyle(style)
ren1.TwoSidedLightingOff()
ren1.ResetCamera()
renWin.Render()
iren.Start()
```
---
### Author:  [@Paulo\_Carvalho](https://discourse.vtk.org/u/Paulo_Carvalho)
#### Post date: [January 13, 2023, 8:33pm UTC](https://discourse.vtk.org/t/resampling-and-ploting-multiple-slices-from-a-vtkpolydata/10443/2 "2023-01-13T20:33:04Z")
It seems to me that your data file contains a `vtkPolyData` with only points for sample support. From your data file:
```xml
```
Hence the data rendered as points.
---
### Author:  [@Paulo\_Carvalho](https://discourse.vtk.org/u/Paulo_Carvalho)
#### Post date: [January 13, 2023, 8:37pm UTC](https://discourse.vtk.org/t/resampling-and-ploting-multiple-slices-from-a-vtkpolydata/10443/3 "2023-01-13T20:37:56Z")
You can increase point size to give it a grid-like look:
```python
actor.GetProperty().SetPointSize( 10 )
```
The example above will set your points to squares or circles (depends on your OpenGL backend) 10-pixel wide/tall.
---
### Author:  [@Jishnu](https://discourse.vtk.org/u/Jishnu)
#### Post date: [January 14, 2023, 5:06am UTC](https://discourse.vtk.org/t/resampling-and-ploting-multiple-slices-from-a-vtkpolydata/10443/4 "2023-01-14T05:06:06Z")
Thank you @Paulo_Carvalho for the suggestion. I tried it, but the plot looks weird as we zoom in. Is there any other way to interpolate the point field data or create contours from the data? I have tried to use the probe filter to sample data to a plane, but no luck.
---
### Author:  [@Paulo\_Carvalho](https://discourse.vtk.org/u/Paulo_Carvalho)
#### Post date: [January 14, 2023, 10:37pm UTC](https://discourse.vtk.org/t/resampling-and-ploting-multiple-slices-from-a-vtkpolydata/10443/5 "2023-01-14T22:37:06Z")
Hello,
You can also try `vtkPointGaussianMapper` as your mapper. It renders the points as something called an impostor in computer graphics jargon. An impostor is a visual representation more complex than the underlying data (e.g. a billboard is an impostor that gives the illusion of immersion by using camera-facing 2D images). Examples here: [https://python.hotexamples.com/examples/vtk/-/vtkPointGaussianMapper/python-vtkpointgaussianmapper-function-examples.html](https://python.hotexamples.com/examples/vtk/-/vtkPointGaussianMapper/python-vtkpointgaussianmapper-function-examples.html) The idea here is to render the points like grid cells without actually building a mesh.
take care,
Paulo
---
### Author:  [@Jishnu](https://discourse.vtk.org/u/Jishnu)
#### Post date: [January 15, 2023, 7:05am UTC](https://discourse.vtk.org/t/resampling-and-ploting-multiple-slices-from-a-vtkpolydata/10443/6 "2023-01-15T07:05:29Z")
Thank you very much @Paulo_Carvalho. I will try this.