# Scatter Plot Markers Not Rending in QQuickVTKItem in Qt QML Application
**URL:** https://discourse.vtk.org/t/scatter-plot-markers-not-rending-in-qquickvtkitem-in-qt-qml-application/16018
**Category:** Support
**Tags:** code
**Created:** [September 8, 2025, 3:05pm UTC](https://discourse.vtk.org/t/scatter-plot-markers-not-rending-in-qquickvtkitem-in-qt-qml-application/16018 "2025-09-08T15:05:17Z")
**Posts on this page:** 2
**Page:** 1
### Author:  [@Parker\_Hranicky](https://discourse.vtk.org/u/Parker_Hranicky)
#### Post date: [September 8, 2025, 3:05pm UTC](https://discourse.vtk.org/t/scatter-plot-markers-not-rending-in-qquickvtkitem-in-qt-qml-application/16018/1 "2025-09-08T15:05:17Z")
Hello!
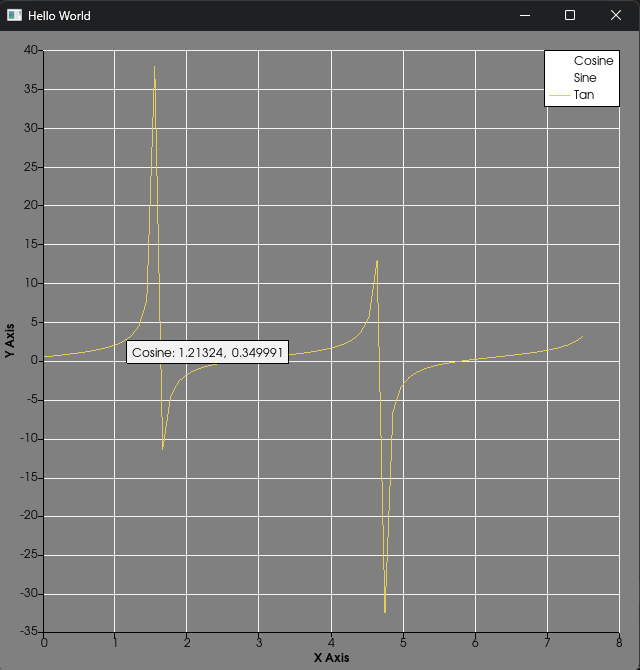
I’ve been using [QQuickVTKItem](https://gitlab.kitware.com/vtk/vtk/-/blob/master/GUISupport/QtQuick/QQuickVTKItem.h?ref_type=heads) in our Qt QML application for line plots for a while now and its worked just fine. Though when I try to use markers to overlay them onto a line plot, or to create a scatter plot, the markers do not render (on the plot or the legend). The issue persists outside of our application when using the [QtQuickChartsOn3DScene](https://gitlab.kitware.com/vtk/vtk/-/tree/master/Examples/GUI/QML/QtQuickChartsOn3DScene?ref_type=heads) example. Attached is a simplified example (modified directly from [QtQuickChartsOn3DScene](https://gitlab.kitware.com/vtk/vtk/-/tree/master/Examples/GUI/QML/QtQuickChartsOn3DScene?ref_type=heads)) displaying just the plot demonstrating that a line plot can be rendered, but markers cannot. Also shows that the chart interactor can still hover over the invisible markers. I also was able to get Markers to properly display using this [scatter plot example](https://examples.vtk.org/site/Cxx/Plotting/ScatterPlot/).
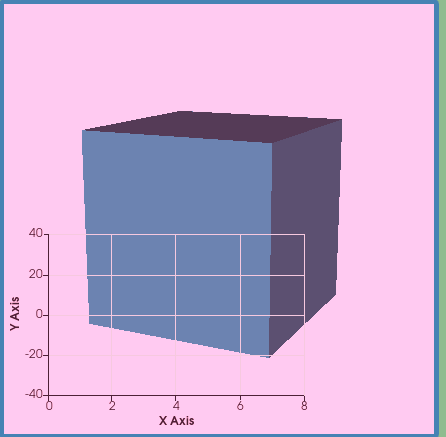
This image shows the unmodified [QtQuickChartsOn3DScene](https://gitlab.kitware.com/vtk/vtk/-/tree/master/Examples/GUI/QML/QtQuickChartsOn3DScene?ref_type=heads) example not rendering the markers:
This image shows the modified example rendering a line plot but not the markers and displaying that the invisible markers still have hover capability:
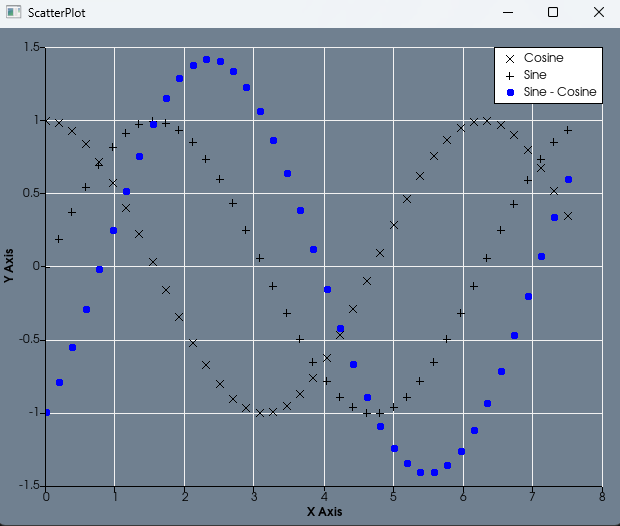
This image displays that the scatter plot example (with no Qt / QML) can render markers properly:
The issue here seems very similar to [this discussion topic](https://discourse.vtk.org/t/scatterplot-example-different-marker-styles-not-working/6414). Although `QQuickVTKItem::setGraphicsApi` looks like it properly sets up the default `QSurfaceFormat` through `QVTKRenderWindowAdapter::defaultformat`.
From what I’ve tried, the issue seems to be something with Qt/QML `QSurfaceFormat`. Though my knowledge of OpenGL / Rendering is limited.
Versions:
Qt: 6.9.1
VTK: v9.5.1
OS Specs: Windows 11 Pro Version 24H2
[QtQuickChartsOn3DSceneModified.zip](https://discourse.vtk.org/uploads/short-url/l8g0OnZZ5lG9RqOB14Bl3HnsJKP.zip) (3.0 KB)
Thanks!
---
### Author:  [@Parker\_Hranicky](https://discourse.vtk.org/u/Parker_Hranicky)
#### Post date: [September 11, 2025, 9:51pm UTC](https://discourse.vtk.org/t/scatter-plot-markers-not-rending-in-qquickvtkitem-in-qt-qml-application/16018/2 "2025-09-11T21:51:34Z")
I seem to have found the issue. The way the vtkOpenGLContextDevice2D seems to work when rendering markers is it requires that `GL_PROGRAM_POINT_SIZE` is disabled. Unless `GL_ES_VERSION_3_0` is enabled, then `cbo->Program->SetUniformf("pointSize", this->Pen->GetWidth());` will run and markers will render fine.
The difference in the Qt app is `GL_PROGRAM_POINT_SIZE` is enabled by default and disabled in the standalone vtk example. Explicitly disabling `GL_PROGRAM_POINT_SIZE` in the `QSGNode` in `QQuickVTKItem` fixes the issue.
Should VTK’s `vtkOpenGLContextDevice2D` be updated to **always** set the `pointSize` uniform (not just in the `GL_ES_VERSION_3_0` branch) so it works consistently whether `GL_PROGRAM_POINT_SIZE` is enabled or not? Or is the intended contract that VTK’s chart code _requires_ `GL_PROGRAM_POINT_SIZE` to be disabled, and it’s the embedding application’s responsibility to enforce that state?