# ScatterPlot Example: Different marker styles not working?

**URL:** https://discourse.vtk.org/t/scatterplot-example-different-marker-styles-not-working/6414
**Category:** Support
**Created:** [August 18, 2021, 12:05pm UTC](https://discourse.vtk.org/t/scatterplot-example-different-marker-styles-not-working/6414 "2021-08-18T12:05:56Z")
**Posts on this page:** 3
**Page:** 1

<div class="post-metadata">

### Author: ![nicfel](https://discourse.vtk.org/user_avatar/discourse.vtk.org/nicfel/32/3639_2.png) [@nicfel](https://discourse.vtk.org/u/nicfel)
#### Post date: [August 18, 2021, 12:05pm UTC](https://discourse.vtk.org/t/scatterplot-example-different-marker-styles-not-working/6414/1 "2021-08-18T12:05:56Z")

</div>

Hello everyone!

I am working on a project where I use VTK alongside Qt. I am trying to render a chart inside of _QDockWidget_. I have a class that extends _QVTKOpenGLNativeWidget_ and stores a renderer (_vtkRenderer_) and a render window (_vtkGenericOpenGLRenderWindow_). For starters I tried to render the ScatterPlot example. Here is my code:

```auto
SceneWidget2D::SceneWidget2D()
        : mRenderWindow(vtkSmartPointer<vtkGenericOpenGLRenderWindow>::New())
        , mRenderer(vtkSmartPointer<vtkRenderer>::New())
	{
        setRenderWindow(mRenderWindow);

        vtkNew<vtkContextActor> cActor;

        vtkNew<vtkNamedColors> colors;
        mRenderer->SetBackground(colors->GetColor3d("SlateGray").GetData());

        vtkNew<vtkChartXY> chart;
        cActor->GetScene()->AddItem(chart);
        chart->SetShowLegend(true);

        // Create a table with some points in it...
        vtkNew<vtkTable> table;

        vtkNew<vtkFloatArray> arrX;
        arrX->SetName("X Axis");
        table->AddColumn(arrX);

        vtkNew<vtkFloatArray> arrC;
        arrC->SetName("Cosine");
        table->AddColumn(arrC);

        vtkNew<vtkFloatArray> arrS;
        arrS->SetName("Sine");
        table->AddColumn(arrS);

        vtkNew<vtkFloatArray> arrT;
        arrT->SetName("Sine - Cosine");
        table->AddColumn(arrT);

        // Test charting with a few more points...
        int numPoints = 40;
        float inc = 7.5f / (numPoints - 1);
        table->SetNumberOfRows(numPoints);
        for (int i = 0; i < numPoints; ++i)
        {
            table->SetValue(i, 0, i * inc);
            table->SetValue(i, 1, cos(i * inc) + 0.0);
            table->SetValue(i, 2, sin(i * inc) + 0.0);
            table->SetValue(i, 3, sin(i * inc) - cos(i * inc));
        }

        // Add multiple scatter plots, setting the colors etc
        vtkPlot* points = chart->AddPlot(vtkChart::POINTS);
        points->SetInputData(table, 0, 1);
        points->SetColor(0, 0, 0, 255);
        points->SetWidth(1.0);
        dynamic_cast<vtkPlotPoints*>(points)->SetMarkerStyle(vtkPlotPoints::CROSS);

        points = chart->AddPlot(vtkChart::POINTS);
        points->SetInputData(table, 0, 2);
        points->SetColor(0, 0, 0, 255);
        points->SetWidth(1.0);
        dynamic_cast<vtkPlotPoints*>(points)->SetMarkerStyle(vtkPlotPoints::PLUS);

        points = chart->AddPlot(vtkChart::POINTS);
        points->SetInputData(table, 0, 3);
        points->SetColor(0, 0, 255, 255);
        points->SetWidth(1.0);
        dynamic_cast<vtkPlotPoints*>(points)->SetMarkerStyle(vtkPlotPoints::CIRCLE);

        mRenderer->AddActor(cActor);
        // add renderer to the window
        mRenderWindow->AddRenderer(mRenderer);
        mRenderWindow->SetMultiSamples(0);

```

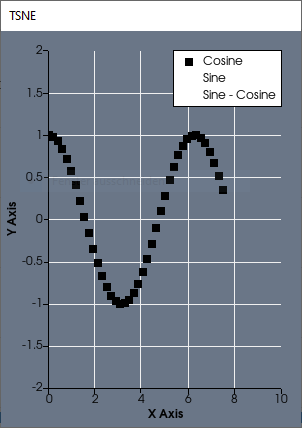
I had to do some adaptations because I didnt need vtkContextView since I already have my renderer and render window. I instead use the vtkContextActor. Here is what the result looks like:  
 ![grafik](https://discourse.vtk.org/uploads/default/original/2X/b/b3bfa8d06136f37f8ffce505f10af33f9ed4a57c.png)  
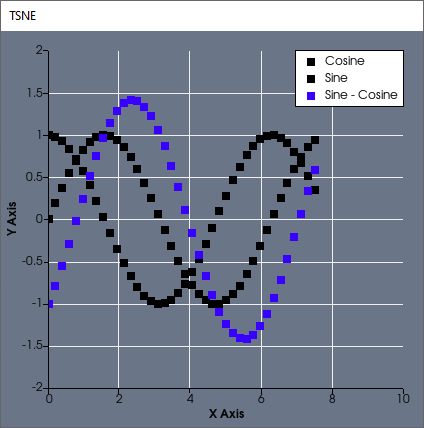
As you can see the 2nd and 3rd plot are not shown. Additionally when I change the marker style of the first plot to vtkPlotPoints::CIRCLE no plots are shown anymore. When I change them all to squares it works for all 3 plots:  
 ![grafik](https://discourse.vtk.org/uploads/default/original/2X/a/af0848aaf4a4b1b58c2708179b368483914ce490.png)

I would really like to use a different marker style here. Any suggestions?

---

<div class="post-metadata">

### Author: ![codeling](https://discourse.vtk.org/user_avatar/discourse.vtk.org/codeling/32/3792_2.png) [@codeling](https://discourse.vtk.org/u/codeling)
#### Post date: [August 18, 2021, 1:04pm UTC](https://discourse.vtk.org/t/scatterplot-example-different-marker-styles-not-working/6414/2 "2021-08-18T13:04:11Z")

</div>

I have encountered similar trouble recently - this comes from the surface format not being set like VTK expects it.

```
QSurfaceFormat::setDefaultFormat(QVTKOpenGLNativeWidget::defaultFormat());

```

should help, or a more targeted `setFormat` on the `QVTKOpenGLNativeWidget` containing the scatter plot

---

<div class="post-metadata">

### Author: ![nicfel](https://discourse.vtk.org/user_avatar/discourse.vtk.org/nicfel/32/3639_2.png) [@nicfel](https://discourse.vtk.org/u/nicfel)
#### Post date: [August 18, 2021, 2:10pm UTC](https://discourse.vtk.org/t/scatterplot-example-different-marker-styles-not-working/6414/3 "2021-08-18T14:10:47Z")

</div>

Thanks a lot 🙂
