# Show UnstructuredGrid as isosurface?
**URL:** https://discourse.vtk.org/t/show-unstructuredgrid-as-isosurface/9306
**Category:** Development
**Tags:** python, code
**Created:** [September 9, 2022, 4:08pm UTC](https://discourse.vtk.org/t/show-unstructuredgrid-as-isosurface/9306 "2022-09-09T16:08:03Z")
**Posts on this page:** 5
**Page:** 1
### Author:  [@lasc95](https://discourse.vtk.org/u/lasc95)
#### Post date: [September 9, 2022, 4:08pm UTC](https://discourse.vtk.org/t/show-unstructuredgrid-as-isosurface/9306/1 "2022-09-09T16:08:03Z")
Hi, I am new in VTK, and I have a vtk UnstructuredGridFile and I read it, but it show me with polygons and I need to deploy it as isosurface. This is my code
I can’t upload an image (I am a new user here). I need help pls
```auto
from vtk import (vtkUnstructuredGridReader, vtkDataSetMapper, vtkActor,
vtkRenderer, vtkRenderWindow, vtkRenderWindowInteractor, vtkContourFilter)
from vtk import *
file_name = 'prueba_leo.vtk'
reader = vtkUnstructuredGridReader()
reader.SetFileName(file_name)
reader.Update()
output = reader.GetOutput()
output_port = reader.GetOutputPort()
scalar_range = output.GetScalarRange()
#add filter NUEVO
c2p = vtkCellDataToPointData()
c2p.SetInputData(output)
contours = vtkContourGrid()
contours.SetInputData(c2p.GetOutput())
contours.SetValue(0, 9)
#create the mappers
#import pdb; pdb.set_trace()
#mapper = vtkDataSetMapper()
#mapper.SetInputConnection(output_port)
#mapper.SetScalarRange(scalar_range)
gridmapper = vtkDataSetMapper()
gridmapper.SetInputData(output)
#gridmapper.GetInput().GetCellData().SetActiveScalars("A")
gridmapper.SetScalarVisibility(1)
gridmapper.SetScalarRange(scalar_range)
#creamos el otro mapper
mapper = vtkPolyDataMapper()
mapper.SetInputConnection(contours.GetOutputPort())
#create The Actor
actor = vtkActor()
actor.SetMapper(mapper)
gridactor = vtkActor()
gridactor.SetMapper(gridmapper)
gridactor.GetProperty().EdgeVisibilityOn()
# Create the Renderer
renderer = vtkRenderer()
renderer.AddActor(actor)
renderer.AddActor(gridactor)
renderer.SetBackground(1, 1, 1) # Set background to white
# Create the RendererWindow
renderer_window = vtkRenderWindow()
renderer_window.AddRenderer(renderer)
# Create the RendererWindowInteractor and display the vtk_file
interactor = vtkRenderWindowInteractor()
interactor.SetRenderWindow(renderer_window)
interactor.Initialize()
interactor.Start()
```
here are the files [files](https://drive.google.com/drive/folders/1St0f_GaCI2H60RVRmJzTkLMQeqV7DhAt?usp=sharing)
---
### Author:  [@banesullivan](https://discourse.vtk.org/u/banesullivan)
#### Post date: [September 9, 2022, 9:10pm UTC](https://discourse.vtk.org/t/show-unstructuredgrid-as-isosurface/9306/2 "2022-09-09T21:10:38Z")
If you are new to VTK, then I would highly recommend using a high-level framework built on top of VTK to make solving this problem more approachable.
Such high-level frameworks include but are not limited to: [ParaView](https://www.paraview.org/), [vedo](https://vedo.embl.es/), [Mayavi](https://docs.enthought.com/mayavi/mayavi/), and [PyVista](https://docs.pyvista.org/).
If graphical user interfaces are your thing, then definitely try ParaView first
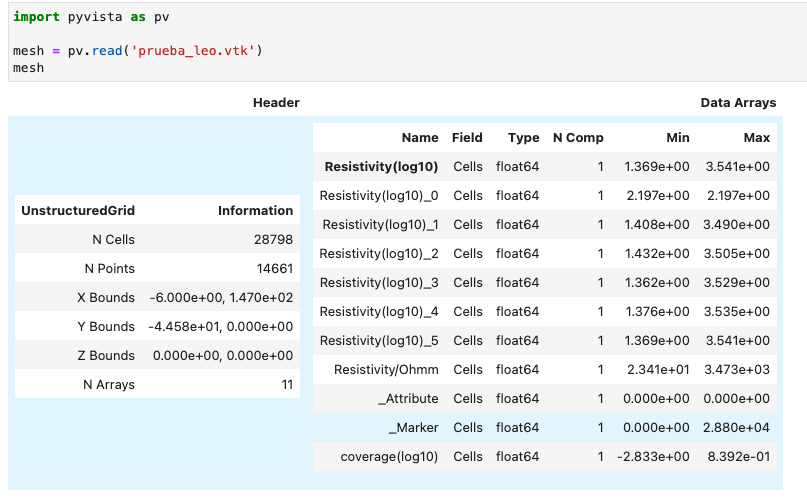
Here is an example with PyVista to solve the problem of generating isosurfaces:
```python
import pyvista as pv
mesh = pv.read('prueba_leo.vtk')
mesh
```
PyVista makes it easy to see what data arrays are present:
A simple plot
```python
plotter = pv.Plotter(notebook=0)
plotter.add_mesh(mesh, scalars='Resistivity/Ohmm', cmap='jet', clim=[5,700],)
plotter.view_xy()
plotter.show()
```
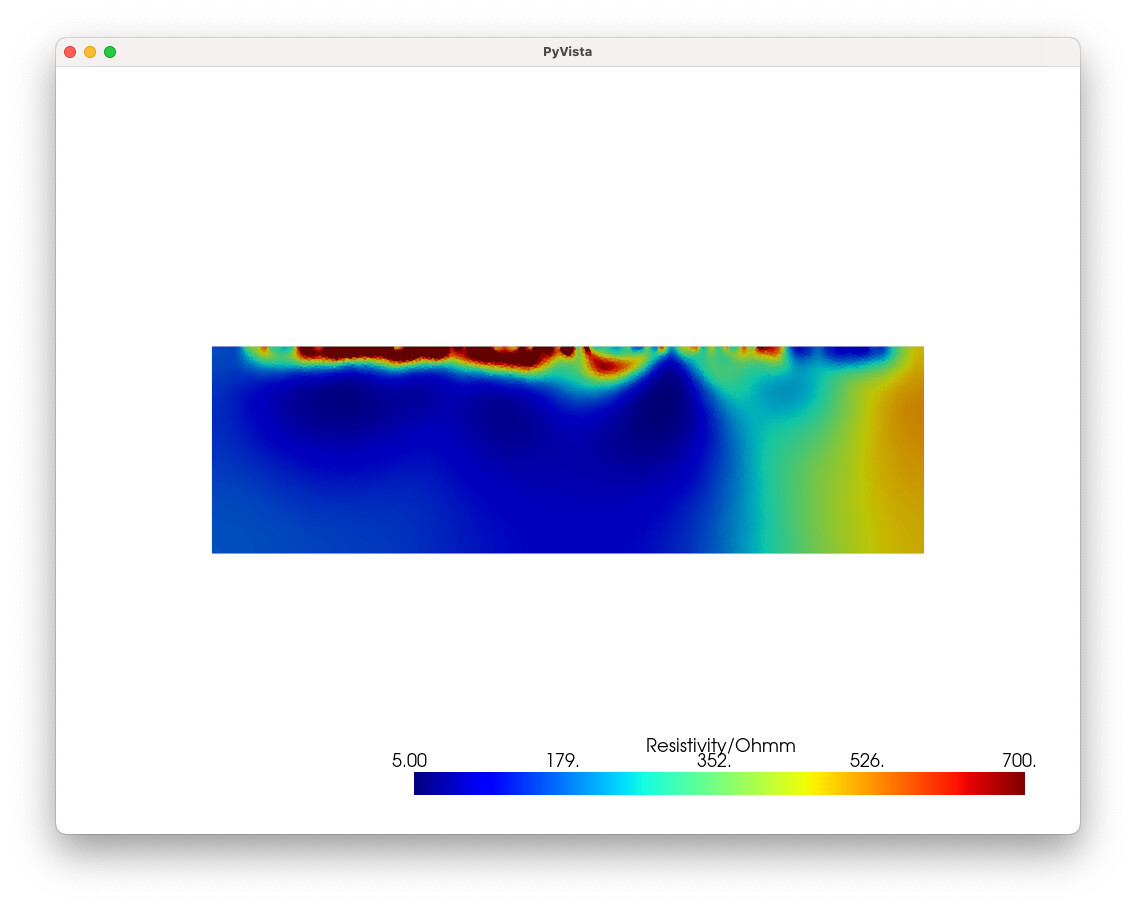
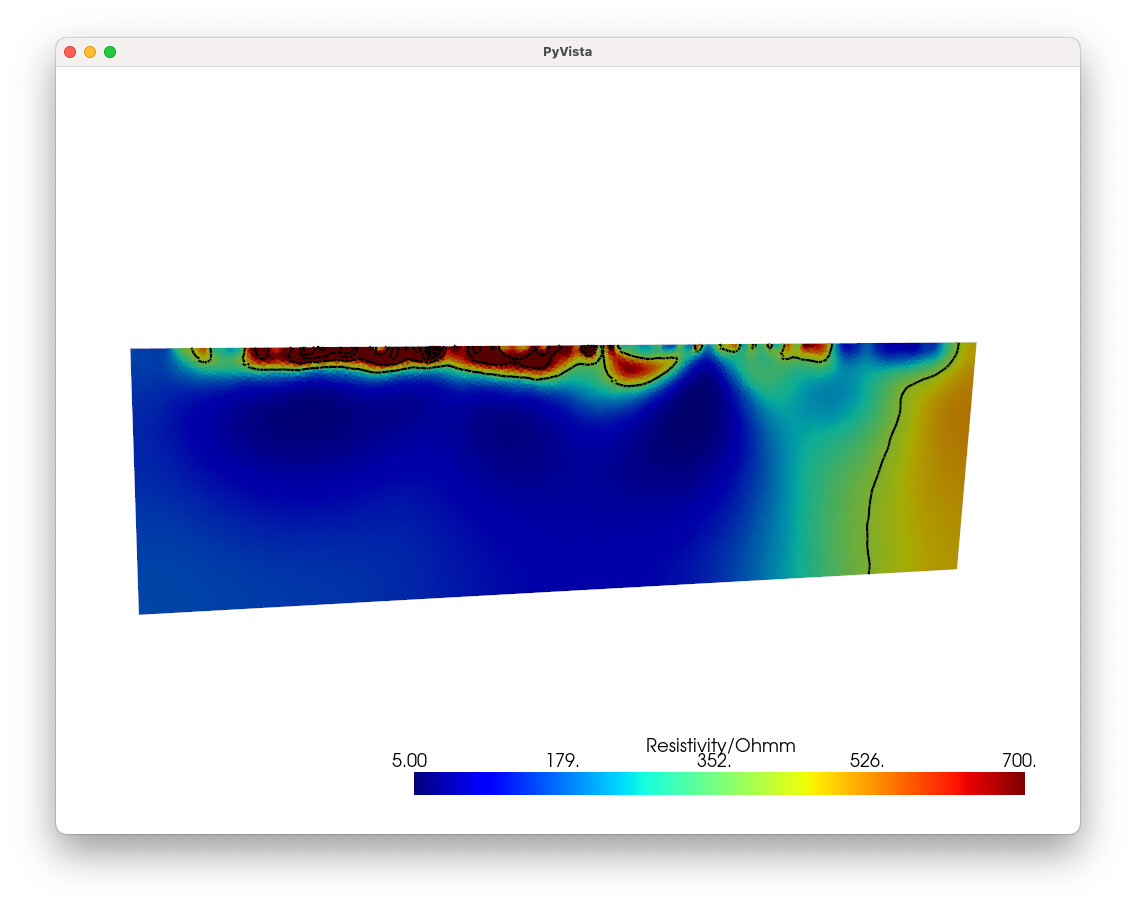
Since your data are a 2D surface, taking contours will generate isolines rather than isosrufaces.
Generate isolines with a contour filter:
```python
# Must migrate cell data to point data for contouring to work
iso = mesh.cell_data_to_point_data().contour(10, scalars='Resistivity/Ohmm') # <- creates 10 isosurfaces
plotter = pv.Plotter(notebook=0)
plotter.add_mesh(iso, color='black', line_width=5)
plotter.add_mesh(mesh, scalars='Resistivity/Ohmm', cmap='jet', clim=[5,700],)
plotter.view_xy()
plotter.show()
```
Hope this helps!
---
### Author:  [@lasc95](https://discourse.vtk.org/u/lasc95)
#### Post date: [September 9, 2022, 9:51pm UTC](https://discourse.vtk.org/t/show-unstructuredgrid-as-isosurface/9306/3 "2022-09-09T21:51:00Z")
God Bless you, thanks! I’m gonna study Pyvista, but I’m new in this kind of job (it’s my first and Im so excited) and I want to learn how to do this in vtk, can you help me if you want of course… Thanks, you saved my position!
Blessings

---
### Author:  [@banesullivan](https://discourse.vtk.org/u/banesullivan)
#### Post date: [September 9, 2022, 10:30pm UTC](https://discourse.vtk.org/t/show-unstructuredgrid-as-isosurface/9306/4 "2022-09-09T22:30:46Z")
Power to you for wanting to learn VTK proper! I, unfortunately, do not have the bandwidth to walk through a full example in pure VTK to do this. But the VTK examples is a great place to get started: [https://kitware.github.io/vtk-examples/site/](https://kitware.github.io/vtk-examples/site/)
---
### Author:  [@Christos\_Tsolakis](https://discourse.vtk.org/u/Christos_Tsolakis)
#### Post date: [September 15, 2022, 1:48am UTC](https://discourse.vtk.org/t/show-unstructuredgrid-as-isosurface/9306/5 "2022-09-15T01:48:50Z")
Hi @lasc95 ,
for someone new to VTK this is very good !
There are only two minor issues with your script.
First:
```python
c2p = vtkCellDataToPointData()
c2p.SetInputData(output)
contours = vtkContourGrid()
contours.SetInputData(c2p.GetOutput())
# c2p.GetOutput() is empty ! To validate : call print(c2p.GetOutput().GetNumberOfPoints())
```
Since you are using `SetInputData`/`GetOutput` API you need to call `c2p.Update()` before calling `c2p.GetOutput()`
Also:
```python
contours.SetValue(0, 9)
```
This means that you want a contour line at value 9. The selected array (first in your dataset) however has values only in the range:
```python
array = c2p.GetOutput().GetPointData().GetArray(0)
vrange = array.GetValueRange()
print(array.GetName())
print(vrange)
Resistivity(log10)
(1.3729533657979573, 3.5309165269118665)
```
so you need to either pick a value in this range or automatically generate few in the range. For the latter you can do:
```python
contours.GenerateValues(10,vrange[0],vrange[1])
```
Now the fitler should work as you expect. To make things more visible I would also suggest to place the contour line actor after the grid.
Here is an edited version of your script:
```python
from vtk import (vtkUnstructuredGridReader, vtkDataSetMapper, vtkActor,
vtkRenderer, vtkRenderWindow, vtkRenderWindowInteractor, vtkContourFilter)
from vtk import *
file_name = 'prueba_leo.vtk'
reader = vtkUnstructuredGridReader()
reader.SetFileName(file_name)
reader.Update()
output = reader.GetOutput()
output_port = reader.GetOutputPort()
scalar_range = output.GetScalarRange()
#add filter NUEVO
c2p = vtkCellDataToPointData()
c2p.SetInputData(output)
## Generate output !
c2p.Update()
contours = vtkContourGrid()
contours.SetInputData(c2p.GetOutput())
## Pick values in range:
#contours.SetValue(0, 2)
# or
array = c2p.GetOutput().GetPointData().GetArray(0)
vrange = array.GetValueRange()
contours.GenerateValues(10,vrange[0],vrange[1])
contours.Update()
#create the mappers
#import pdb; pdb.set_trace()
#mapper = vtkDataSetMapper()
#mapper.SetInputConnection(output_port)
#mapper.SetScalarRange(scalar_range)
gridmapper = vtkDataSetMapper()
gridmapper.SetInputData(output)
#gridmapper.GetInput().GetCellData().SetActiveScalars("A")
gridmapper.SetScalarVisibility(1)
gridmapper.SetScalarRange(scalar_range)
#creamos el otro mapper
mapper = vtkPolyDataMapper()
mapper.SetInputConnection(contours.GetOutputPort())
#create The Actor
actor = vtkActor()
actor.SetMapper(mapper)
gridactor = vtkActor()
gridactor.SetMapper(gridmapper)
gridactor.GetProperty().EdgeVisibilityOn()
# Create the Renderer
renderer = vtkRenderer()
# draw first the grid and then the lines.
renderer.AddActor(gridactor)
renderer.AddActor(actor)
renderer.SetBackground(1, 1, 1) # Set background to white
# Create the RendererWindow
renderer_window = vtkRenderWindow()
renderer_window.AddRenderer(renderer)
# Create the RendererWindowInteractor and display the vtk_file
interactor = vtkRenderWindowInteractor()
interactor.SetRenderWindow(renderer_window)
interactor.Initialize()
interactor.Start()
```