# Sort points on line in PolyData
**URL:** https://discourse.vtk.org/t/sort-points-on-line-in-polydata/3851
**Category:** Support
**Created:** [July 24, 2020, 9:14pm UTC](https://discourse.vtk.org/t/sort-points-on-line-in-polydata/3851 "2020-07-24T21:14:20Z")
**Posts on this page:** 20
**Page:** 1
### Author:  [@jrwrigh](https://discourse.vtk.org/u/jrwrigh)
#### Post date: [July 24, 2020, 9:14pm UTC](https://discourse.vtk.org/t/sort-points-on-line-in-polydata/3851/1 "2020-07-24T21:14:21Z")
So I have a PolyData object of lines generated from extracting feature edges from a 2D unstructured grid and then cutting out portions of the feature edges I didn’t want.
In my example, the original grid was just a square, so the feature edges would equally just be a square. Then I “extracted” out one side of the square. I would like to have the points of this PolyData object be in the order of the line, as currently they are more-or-less random.
From [this definition](https://lorensen.github.io/VTKExamples/site/Cxx/GeometricObjects/PolyLine/) on the VTK examples website, maybe the solution would be to convert the PolyData to a PolyLine? I can’t find any obvious path to achieve this though.
---
### Author:  [@lassoan](https://discourse.vtk.org/u/lassoan)
#### Post date: [July 25, 2020, 2:36am UTC](https://discourse.vtk.org/t/sort-points-on-line-in-polydata/3851/2 "2020-07-25T02:36:06Z")
You can use [vtkStripper](https://vtk.org/doc/nightly/html/classvtkStripper.html) to merge randomly ordered line segments into polylines. If the polydata is large then you may need to increase [MaximumLength](https://vtk.org/doc/nightly/html/classvtkStripper.html#aeab155d6b9e698f1287af154570d73ba).
---
### Author:  [@jrwrigh](https://discourse.vtk.org/u/jrwrigh)
#### Post date: [August 6, 2020, 5:33pm UTC](https://discourse.vtk.org/t/sort-points-on-line-in-polydata/3851/3 "2020-08-06T17:33:25Z")
So this does work, but it has the unintended effect of combining the individual cells into single lines. ie.
```python
wallpoly.GetNumberOfCells() # 1246
strip = vtk.vtkStripper()
strip.SetInputData(wallpoly.GetOutput())
strip.Update()
wallstrip = strip.GetOutput()
wallstrip.GetNumberOfCells() # 2
```
I tried setting `strip.SetJoinContiguousSegments(False)`, but this did not change anything. It’s not a deal breaker by any means, but it would be nice to preserve the cells/lines.
---
### Author:  [@PBrockmann](https://discourse.vtk.org/u/PBrockmann)
#### Post date: [April 6, 2023, 12:52pm UTC](https://discourse.vtk.org/t/sort-points-on-line-in-polydata/3851/4 "2023-04-06T12:52:25Z")
Hi,
Indeed I haven’t been able to notice a difference when strip.SetJoinContiguousSegments() is set to True.
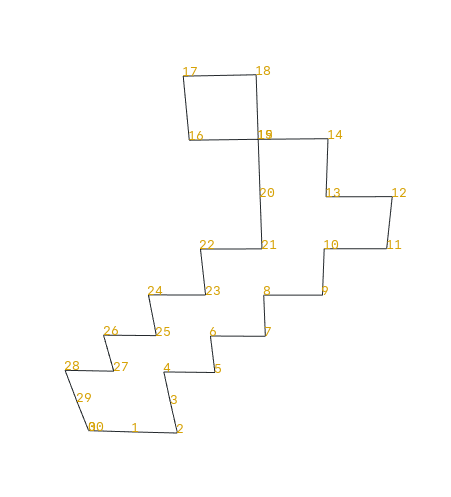
How to sort anti-clockwise points from a polydata ?
You will see that points 16, 17, 18 are not ordered correctly if you expect an anti-clockwise sort.
```auto
from vedo import *
! wget -q -nc https://thredds-su.ipsl.fr/thredds/fileServer/ipsl_thredds/brocksce/tmp/poly_02.vtk
g = load('poly_02.vtk')
line = Line(g.points())
labels = line.labels2d(c="yellow4", scale=0.7)
show(line, labels, axes=0, interactive=True, zoom=1, roll=90, azimuth=-90, elevation=0)
```
---
### Author:  [@lassoan](https://discourse.vtk.org/u/lassoan)
#### Post date: [April 6, 2023, 1:17pm UTC](https://discourse.vtk.org/t/sort-points-on-line-in-polydata/3851/5 "2023-04-06T13:17:12Z")
If the polygon is self-intersecing then you can split it to non-intersecting polygons, determine the winding direction for each polygon, and then merge the polygons.
---
### Author:  [@PBrockmann](https://discourse.vtk.org/u/PBrockmann)
#### Post date: [April 6, 2023, 1:34pm UTC](https://discourse.vtk.org/t/sort-points-on-line-in-polydata/3851/6 "2023-04-06T13:34:57Z")
Hi Andreas,
This is indeed a strategy.
But I haven’t found how to split it.
See [create separated regions from polydata - #25 by Paulo\_Carvalho](https://discourse.vtk.org/t/create-separated-regions-from-polydata/10409/25)
Your snippet of codes are welcomed.
---
### Author:  [@marcomusy](https://discourse.vtk.org/u/marcomusy)
#### Post date: [April 6, 2023, 2:23pm UTC](https://discourse.vtk.org/t/sort-points-on-line-in-polydata/3851/7 "2023-04-06T14:23:12Z")
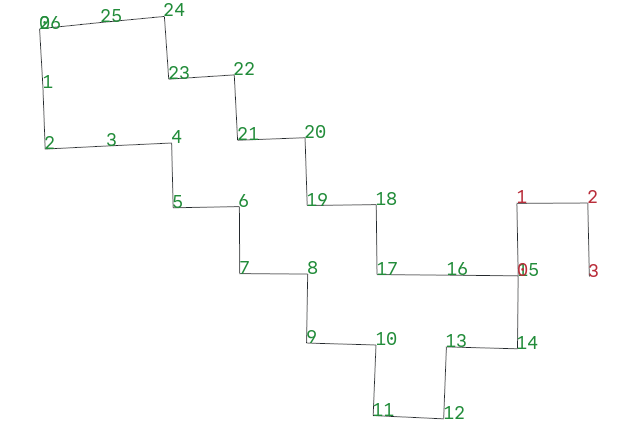
…you need to parse the line connectivity and split where needed as Andras suggests, it’s a numpy exercise… e.g.
```py
from vedo import *
g = load('data/poly_02.vtk')
lines = Line(g.points()).clean().join_segments()
line = lines[0]
pts = line.points()
crosses = []
for i in range(1, line.npoints):
if len(line.connected_cells(i, return_ids=True)) > 1:
crosses.append(i)
print("crosses", crosses)
# split numpy array into subarrays at specific indices
arr = np.array(line.lines()[0])
splits = np.where(arr == crosses[0])[0]
print("splits", splits)
# form 2 lines from the split array
twolines = [
np.split(arr, splits)[0].tolist() + np.split(arr, splits)[2].tolist(),
np.split(arr, splits)[1].tolist(),
]
print('twolines', twolines)
line1, line2 = Line(pts[twolines[0]]), Line(pts[twolines[1]])
labels1 = line1.labels2d(c="green4")
labels2 = line2.labels2d(c="red4")
show(line1, labels1, line2, labels2).close()
show(line1.triangulate().bc('red4'), line2.triangulate().bc('red4'))
```

---
### Author:  [@PBrockmann](https://discourse.vtk.org/u/PBrockmann)
#### Post date: [April 6, 2023, 3:08pm UTC](https://discourse.vtk.org/t/sort-points-on-line-in-polydata/3851/8 "2023-04-06T15:08:41Z")
Ok nice. Thanks
I am testing the code.
And describe coordinates anti-clockwise, is the a way to do this ?
---
### Author:  [@marcomusy](https://discourse.vtk.org/u/marcomusy)
#### Post date: [April 6, 2023, 3:20pm UTC](https://discourse.vtk.org/t/sort-points-on-line-in-polydata/3851/9 "2023-04-06T15:20:13Z")
yes, you can compute the winding direction of each loop and reverse the point IDs order based on its sign, e.g.
```py
data = np.asarray(points)
datamean = data.mean(axis=0)
pts = data - datamean
res = np.linalg.svd(pts)
dd, vv = res[1], res[2]
n = np.cross(vv[0], vv[1])
v = np.zeros_like(pts)
for i in range(len(pts) - 1):
vi = np.cross(pts[i], pts[i + 1])
v[i] = vi / np.linalg.norm(vi)
ns = np.mean(v, axis=0) # normal to the points plane
if np.dot(n, ns) < 0:
n = -n
```
the less trivial part is the triangulation i guess… (you may consider some non linear 2d map projection…)
---
### Author:  [@PBrockmann](https://discourse.vtk.org/u/PBrockmann)
#### Post date: [April 6, 2023, 3:24pm UTC](https://discourse.vtk.org/t/sort-points-on-line-in-polydata/3851/10 "2023-04-06T15:24:34Z")
Ok. Less trivial as you wrote.
No vtk higher level function to do that ?
---
### Author:  [@marcomusy](https://discourse.vtk.org/u/marcomusy)
#### Post date: [April 6, 2023, 3:36pm UTC](https://discourse.vtk.org/t/sort-points-on-line-in-polydata/3851/11 "2023-04-06T15:36:17Z")
the orientation? i’m not sure… maybe a combination of `vtkReverseSense` and `vtkPolyDataNormals` with `ConsistencyOn()`…
---
### Author:  [@PBrockmann](https://discourse.vtk.org/u/PBrockmann)
#### Post date: [April 6, 2023, 10:46pm UTC](https://discourse.vtk.org/t/sort-points-on-line-in-polydata/3851/12 "2023-04-06T22:46:05Z")
> [@marcomusy](#):
>
> ```auto
> # form 2 lines from the split array
> twolines = [
> np.split(arr, splits)[0].tolist() + np.split(arr, splits)[2].tolist(),
> np.split(arr, splits)[1].tolist(),
> ]
>
> ```
This kind of specific settings (here made for only 1 cross) do not resist when you want to generalize the algorithm.

---
### Author:  [@Paulo\_Carvalho](https://discourse.vtk.org/u/Paulo_Carvalho)
#### Post date: [April 7, 2023, 1:46pm UTC](https://discourse.vtk.org/t/sort-points-on-line-in-polydata/3851/13 "2023-04-07T13:46:58Z")
Hello,
Maybe you can try the Shapely library: [python - Splitting self-intersecting polygon only returned one polygon in Shapely - Stack Overflow](https://stackoverflow.com/questions/35110632/splitting-self-intersecting-polygon-only-returned-one-polygon-in-shapely)
best,
PC
---
### Author:  [@Paulo\_Carvalho](https://discourse.vtk.org/u/Paulo_Carvalho)
#### Post date: [April 7, 2023, 2:01pm UTC](https://discourse.vtk.org/t/sort-points-on-line-in-polydata/3851/14 "2023-04-07T14:01:15Z")
Hello,
@marcomusy’s answer uses NumPy for performance critical operations (e.g. singular value decomposition), if that is your concern. And certainly the `for` loop can be avoided by vectorized calls to the cross product and the vector norm. NumPy is supposed to be a decent alternative to its Matlab equivalents. Vectorizing NumPy functions normally takes the standard of telling it how to iterate over the vectors according to how they are arranged in a matrix (e.g. `np.linalg.norm(x, axis=1)` if you have the point data as row-vectors). See this: [python - How to apply numpy.linalg.norm to each row of a matrix? - Stack Overflow](https://stackoverflow.com/questions/7741878/how-to-apply-numpy-linalg-norm-to-each-row-of-a-matrix) . The cross product function likely follows the same rationale.
regards,
PC
---
### Author:  [@PBrockmann](https://discourse.vtk.org/u/PBrockmann)
#### Post date: [April 7, 2023, 2:06pm UTC](https://discourse.vtk.org/t/sort-points-on-line-in-polydata/3851/15 "2023-04-07T14:06:22Z")
Yes indeed. Have tried but shapely does not work in 3D.
I wanted to have separate polylines from the vtk process.
So my concern is why there is 2 cells detected for the region 7.
I do not understand why.
```auto
import pyvista as pv
import vtk
import random
! wget -q -nc https://thredds-su.ipsl.fr/thredds/fileServer/ipsl_thredds/brocksce/pyvista/mesh3D.vtk
mesh = pv.PolyData('mesh3D.vtk')
edges = mesh.extract_feature_edges(boundary_edges=True)
pl = pv.Plotter()
pl.add_mesh(pv.Sphere(radius=6300E3, theta_resolution=360, phi_resolution=180))
pl.add_mesh(mesh, show_edges=True, edge_color="gray")
regions = edges.connectivity()
regCount = len(set(regions.get_array("RegionId")))
connectivityFilter = vtk.vtkPolyDataConnectivityFilter()
stripper = vtk.vtkStripper()
#r_choice = 7
for r in range(regCount):
#for r in [r_choice]:
connectivityFilter.SetInputData(edges)
connectivityFilter.SetExtractionModeToSpecifiedRegions()
connectivityFilter.InitializeSpecifiedRegionList()
connectivityFilter.AddSpecifiedRegion(r)
connectivityFilter.Update()
stripper.SetInputData(connectivityFilter.GetOutput())
stripper.SetJoinContiguousSegments(True)
stripper.Update()
cleaner = vtk.vtkCleanPolyData()
cleaner.SetInputData(stripper.GetOutput())
cleaner.Update()
reg = cleaner.GetOutput()
print(r, reg.GetNumberOfCells(), reg.GetNumberOfPoints())
if r == r_choice:
p = pv.PolyData(reg)
p.save('poly_%02d.vtk' %(r_choice))
random_color = "#"+''.join([random.choice('0123456789ABCDEF') for i in range(6)])
pl.add_mesh(reg, color=random_color, line_width=4)
viewer = pl.show(jupyter_backend='trame', return_viewer=True)
display(viewer)
```
```auto
0 1 294
1 1 556
2 1 29
3 1 8
4 1 80
5 1 838
6 1 24
7 2 56 <----- 2 cells !
8 1 38
9 1 42
10 1 22
11 1 19
12 1 22
13 1 44
14 1 44
15 1 26
16 1 90
17 1 12
18 1 11
19 1 14
20 1 19
21 1 11
```
---
### Author:  [@Paulo\_Carvalho](https://discourse.vtk.org/u/Paulo_Carvalho)
#### Post date: [April 7, 2023, 2:10pm UTC](https://discourse.vtk.org/t/sort-points-on-line-in-polydata/3851/16 "2023-04-07T14:10:25Z")
> [@PBrockmann](#):
>
> Yes indeed. Have tried but shapely does not work in 3D.
Your problem is not truly 3-D. Your data are locations on the Earth, so working with their XYZ positions is an unnecessary complication. I strongly recommend working with lat-long polar values or use some projection suitable for world maps (e.g. Mercator) if you want to work with Cartesian coordinates.
---
### Author:  [@PBrockmann](https://discourse.vtk.org/u/PBrockmann)
#### Post date: [April 7, 2023, 2:15pm UTC](https://discourse.vtk.org/t/sort-points-on-line-in-polydata/3851/17 "2023-04-07T14:15:24Z")
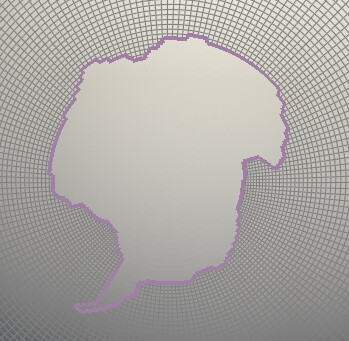
Not agree because finding convex polylines is easier with 3D cartesian coordinates.
Find for example the polyline that describes Antartica continent.
---
### Author:  [@Paulo\_Carvalho](https://discourse.vtk.org/u/Paulo_Carvalho)
#### Post date: [April 7, 2023, 2:15pm UTC](https://discourse.vtk.org/t/sort-points-on-line-in-polydata/3851/18 "2023-04-07T14:15:53Z")
You can convert XYZ absolute postions to polar coordinates with this example: [python - Faster numpy cartesian to spherical coordinate conversion? - Stack Overflow](https://stackoverflow.com/questions/4116658/faster-numpy-cartesian-to-spherical-coordinate-conversion) . The first solution is a vectorized (loop-free) example. Just throw away the radius (will be constant for points in the surface of a sphere) and you’ll reduce your problem to 2D.
---
### Author:  [@Paulo\_Carvalho](https://discourse.vtk.org/u/Paulo_Carvalho)
#### Post date: [April 7, 2023, 2:19pm UTC](https://discourse.vtk.org/t/sort-points-on-line-in-polydata/3851/19 "2023-04-07T14:19:18Z")
From my experience I can tell you: that’s the wrong way to process geographic data. But if you want to stick to 3D data, be warned.
---
### Author:  [@PBrockmann](https://discourse.vtk.org/u/PBrockmann)
#### Post date: [April 7, 2023, 2:23pm UTC](https://discourse.vtk.org/t/sort-points-on-line-in-polydata/3851/20 "2023-04-07T14:23:32Z")
Always hard to have links to other approaches when I have tried to describe the problem with a concrete code ready to be tested.
See the problem described here bellow that comes from polygons that are folded.
>
My strategy was to find each individual convex polylines from vtk, then indeed use shapely to set the order. Then produces maps with cartopy.
[Next page](https://discourse.vtk.org/t/sort-points-on-line-in-polydata/3851.md?page=2)