# Visualise the errors as relative to the magnitude of the deformation
**URL:** https://discourse.vtk.org/t/visualise-the-errors-as-relative-to-the-magnitude-of-the-deformation/10418
**Category:** Support
**Tags:** python
**Created:** [January 10, 2023, 2:43pm UTC](https://discourse.vtk.org/t/visualise-the-errors-as-relative-to-the-magnitude-of-the-deformation/10418 "2023-01-10T14:43:16Z")
**Posts on this page:** 8
**Page:** 1
### Author:  [@isuruwi](https://discourse.vtk.org/u/isuruwi)
#### Post date: [January 10, 2023, 2:43pm UTC](https://discourse.vtk.org/t/visualise-the-errors-as-relative-to-the-magnitude-of-the-deformation/10418/1 "2023-01-10T14:43:16Z")
I have two volumetric liver meshes (groundturht and predicted versions) in .vtk format (i.e. ground-truth and predicted versions) and I want to visualise the errors as relative to the magnitude of the deformation on the corresponding 3D CT volume.
I rendered the groundtruth or the predicted meshes seprately on a given CT slice using vtk.
**However, when I try to get the mesh difference and render on the same slice, I get an error.**
Here is the attached code and a sample meshes file for your further reference.
Could you please help me on resloving this issue.
[gtMesh.vtk](https://discourse.vtk.org/uploads/short-url/nVhJQw4VuhCOwYsyYw0XbGLuBlJ.vtk) (101.5 KB)
[predMesh.vtk](https://discourse.vtk.org/uploads/short-url/qRETL5k24NqtiTnDHNT6TFoCSE7.vtk) (101.5 KB)
```auto
def getMeshPolyData(mesh_path):
meshReader = vtk.vtkUnstructuredGridReader()
meshReader.SetFileName(mesh_path)
meshReader.ReadAllVectorsOn()
meshReader.ReadAllScalarsOn()
meshReader.Update()
meshGeometryFilter = vtk.vtkGeometryFilter()
meshGeometryFilter.SetInputData(meshReader.GetOutput())
meshGeometryFilter.Update()
polyDataForMesh = meshGeometryFilter.GetOutput()
#meshSurfaceSourcePoints = polyDataForMesh.GetPoints()
return polyDataForMesh
reader = vtk.vtkNIFTIImageReader()
reader.SetFileName('.deformed_CTs/sample_CT.nii.gz')
reader.Update()
imageMatrix = reader.GetSFormMatrix()
print('imageMatrix:', imageMatrix)
if imageMatrix is None:
imageMatrix = reader.GetQFormMatrix()
print('imageMatrix:', imageMatrix)
polyDataForPredMesh = getMeshPolyData('./predictions/predMesh.vtk')
polyDataForGTMesh = getMeshPolyData('/groundtruth/gtMesh.vtk')
# polyDataForMesh = meshGeometryFilter.GetOutput()
predMeshPoints = polyDataForPredMesh.GetPoints()
gtMeshPoints = polyDataForGTMesh.GetPoints()
pointsToImage = vtk.vtkTransform()
pointsToImage.Concatenate(imageMatrix)
pointsToImage.Inverse()
# the newSourcePoints and newTargetPoints are in the same coordinate space as the vtkImageData,
# so they can be used to build the reslice transform.
newPredMeshPoints = vtk.vtkPoints()
pointsToImage.TransformPoints(predMeshPoints, newPredMeshPoints)
newGTMeshPoints = vtk.vtkPoints()
pointsToImage.TransformPoints(gtMeshPoints, newGTMeshPoints)
polyDataForGTMesh.SetPoints(newGTMeshPoints)
polyDataForPredMesh.SetPoints(newPredMeshPoints)
calc1 = vtk.vtkArrayCalculator()
calc1.SetInputData(polyDataForGTMesh)
calc1.AddCoordinateScalarVariable("coordsX", 0)
calc1.AddCoordinateScalarVariable("coordsY", 1)
calc1.AddCoordinateScalarVariable("coordsZ", 2)
calc1.SetResultArrayName("groundtruth")
calc1.Update()
calc2 = vtk.vtkArrayCalculator()
calc2.SetInputData(polyDataForPredMesh)
#calc2.SetAttributeModeToUsePointData()
calc2.AddCoordinateScalarVariable("coordsX", 0)
calc2.AddCoordinateScalarVariable("coordsY", 1)
calc2.AddCoordinateScalarVariable("coordsZ", 2)
calc2.SetResultArrayName("prediction")
calc2.Update()
appendFilter = vtk.vtkAppendFilter()
appendFilter.AddInputData(calc1.GetOutput())
appendFilter.AddInputData(calc2.GetOutput())
appendFilter.Update()
calc3 = vtk.vtkArrayCalculator()
calc3.SetInputData(appendFilter.GetOutput())
calc3.SetFunction("abs(prediction-groundtruth)")
calc3.SetResultArrayName("error")
calc3.Update()
vtkImage = reader.GetOutput()
#outline
outline=vtk.vtkOutlineFilter()
outline.SetInputData(vtkImage)
outlineMapper=vtk.vtkPolyDataMapper()
outlineMapper.SetInputConnection(outline.GetOutputPort())
outlineActor = vtk.vtkActor()
outlineActor.SetMapper(outlineMapper)
meshMapper = vtk.vtkPolyDataMapper()
#meshMapper.SetInputData(polyDataForGTMesh)
meshMapper.SetInputData(calc3.GetOutput())
meshActor = vtk.vtkActor()
meshActor.SetMapper(meshMapper)
#Picker
picker = vtk.vtkCellPicker()
picker.SetTolerance(0.005)
#PlaneWidget
planeWidgetX = vtk.vtkImagePlaneWidget()
planeWidgetX.DisplayTextOn()
planeWidgetX.SetInputData(vtkImage)
planeWidgetX.SetPlaneOrientationToXAxes()
planeWidgetX.SetSliceIndex(200)
planeWidgetX.SetPicker(picker)
planeWidgetX.SetKeyPressActivationValue("x")
prop1 = planeWidgetX.GetPlaneProperty()
prop1.SetColor(1, 0, 0)
#Renderer
renderer = vtk.vtkRenderer()
renderer.SetBackground(0, 0, 1)
#RenderWindow
renwin = vtk.vtkRenderWindow()
renwin.AddRenderer(renderer)
#Add outlineactor
renderer.AddActor(outlineActor)
renderer.AddActor(meshActor)
renwin.SetSize(800,800)
interactor = vtk.vtkRenderWindowInteractor()
interactor.SetRenderWindow(renwin)
#Load widget interactors and enable
planeWidgetX.SetInteractor(interactor)
planeWidgetX.On()
# planeWidgetY.SetInteractor(interactor)
# planeWidgetY.On()
# planeWidgetZ.SetInteractor(interactor)
# planeWidgetZ.On()
interactor.Initialize()
renwin.Render()
interactor.Start()
```
---
### Author:  [@isuruwi](https://discourse.vtk.org/u/isuruwi)
#### Post date: [January 12, 2023, 11:51am UTC](https://discourse.vtk.org/t/visualise-the-errors-as-relative-to-the-magnitude-of-the-deformation/10418/2 "2023-01-12T11:51:20Z")
I’m looking for a solution to this. Please some one let me know any steps for this ?
---
### Author:  [@isuruwi](https://discourse.vtk.org/u/isuruwi)
#### Post date: [January 13, 2023, 3:12pm UTC](https://discourse.vtk.org/t/visualise-the-errors-as-relative-to-the-magnitude-of-the-deformation/10418/3 "2023-01-13T15:12:40Z")
I’m still having this problem and can’t seem to figure it out. Please, any suggestions?
---
### Author:  [@dgobbi](https://discourse.vtk.org/u/dgobbi)
#### Post date: [January 14, 2023, 1:00am UTC](https://discourse.vtk.org/t/visualise-the-errors-as-relative-to-the-magnitude-of-the-deformation/10418/4 "2023-01-14T01:00:31Z")
If you run a program and it prints an error, it’s very important to copy & paste the text of the error when you ask people how to fix the error.
My suggestions are:
1. The vtkAppendFilter is the wrong filter to use. It appends the cells of the inputs, so its output will have all of the polygons from both of the inputs.
2. Use vector variables for points
3. Don’t use so many vtkArrayCalculators (you really only need one!)
4. Use ‘mag’ for vectors. Don’t use ‘abs’ for vectors.
Here is some code with no vtkAppendFilter and only one vtkArrayCalculator:
```python
# Get an array from the Points of PredMesh, and add this array to GTMesh
# (Useful hint: GetPoints().GetData() returns an array called 'Points')
polyDataForGTMesh.GetPointData().AddArray(
polyDataForPredMesh.GetPoints().GetData())
# compute distance from the coordinates to the array called 'Points'
calc3 = vtk.vtkArrayCalculator()
calc3.SetInputData(polyDataForGTMesh)
calc3.AddCoordinateVectorVariable("groundtruth") # GT Points
calc3.AddVectorVariable("prediction", "Points") # Pred Points
calc3.SetFunction("mag(prediction - groundtruth)")
calc3.SetResultArrayName("error")
calc3.Update()
```
---
### Author:  [@dgobbi](https://discourse.vtk.org/u/dgobbi)
#### Post date: [January 14, 2023, 1:55pm UTC](https://discourse.vtk.org/t/visualise-the-errors-as-relative-to-the-magnitude-of-the-deformation/10418/6 "2023-01-14T13:55:59Z")
To force the mapper to use the range of the lookup table, use this:
```python
datasetMapper.UseLookupTableScalarRangeOn()
```
---
### Author:  [@isuruwi](https://discourse.vtk.org/u/isuruwi)
#### Post date: [January 14, 2023, 2:34pm UTC](https://discourse.vtk.org/t/visualise-the-errors-as-relative-to-the-magnitude-of-the-deformation/10418/7 "2023-01-14T14:34:26Z")
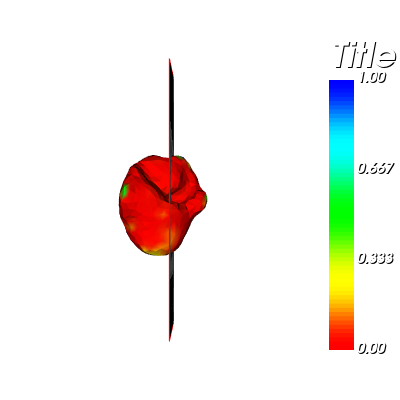
Thank you very much. The colours now appear to be fine, but there is an issue with the value range that appears in the colour bar.
When I print the maximum values of the scalar array (i.e. the ‘error’ array), I discover that the maximum value is 4.1 mm. However, the colour scale range was normalised to a range of 0 to 1.
I tried to fix it by enabling the ScalarVisibilityOn() attribute, but it had no effect.
How can I get this resolved?
On the other thand is there a way taht I can change the colour bar and the lookup table value to fixed range something like 0 to 10 mm range ?
A screenshot is attached for your convenience.
---
### Author:  [@dgobbi](https://discourse.vtk.org/u/dgobbi)
#### Post date: [January 14, 2023, 6:46pm UTC](https://discourse.vtk.org/t/visualise-the-errors-as-relative-to-the-magnitude-of-the-deformation/10418/8 "2023-01-14T18:46:29Z")
You might be missing this:
```python
hueLut.SetRange(0.0, 10.0)
```
---
### Author:  [@isuruwi](https://discourse.vtk.org/u/isuruwi)
#### Post date: [January 15, 2023, 12:49pm UTC](https://discourse.vtk.org/t/visualise-the-errors-as-relative-to-the-magnitude-of-the-deformation/10418/9 "2023-01-15T12:49:31Z")
Thanks. Additing these two lines resolved the issue. Thanks again.
```auto
scalarRange = calc3.GetOutput().GetScalarRange()
datasetMapper.SetScalarRange(scalarRange)
```