# Visualization of 2D height point data.
**URL:** https://discourse.vtk.org/t/visualization-of-2d-height-point-data/3951
**Category:** Support
**Created:** [August 11, 2020, 3:56am UTC](https://discourse.vtk.org/t/visualization-of-2d-height-point-data/3951 "2020-08-11T03:56:07Z")
**Posts on this page:** 5
**Page:** 1
### Author:  [@NeoDreamer](https://discourse.vtk.org/u/NeoDreamer)
#### Post date: [August 11, 2020, 3:56am UTC](https://discourse.vtk.org/t/visualization-of-2d-height-point-data/3951/1 "2020-08-11T03:56:07Z")
I have height point data that shape of 2D matrix.
Which is best way to visualize that data.
---
### Author:  [@Paulo\_Carvalho](https://discourse.vtk.org/u/Paulo_Carvalho)
#### Post date: [August 11, 2020, 11:27pm UTC](https://discourse.vtk.org/t/visualization-of-2d-height-point-data/3951/2 "2020-08-11T23:27:12Z")
Hi, friend,
Do you wish to view it as a “heat map” 2D image, as a 3D surface or as contour lines?
regards,
Paulo
---
### Author:  [@NeoDreamer](https://discourse.vtk.org/u/NeoDreamer)
#### Post date: [August 12, 2020, 1:35am UTC](https://discourse.vtk.org/t/visualization-of-2d-height-point-data/3951/3 "2020-08-12T01:35:09Z")
Thanks, Paulo.
I want to view as 3D surface my data like the below image.
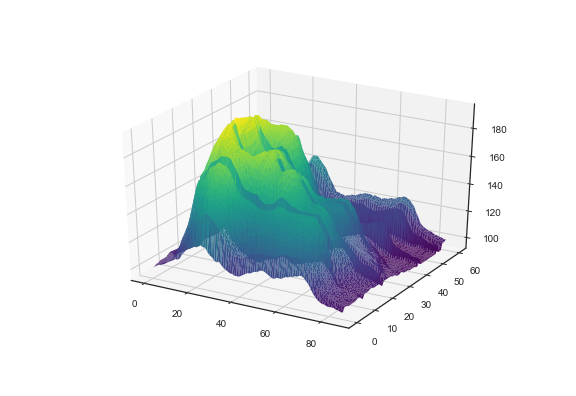
My data consists of float array value and it has different row spacing and col spacing.
So I try to use vtkImageData, but I don’t know how to do that.
Is it right way or not? Do I need another data object?
Regards.
---
### Author:  [@Paulo\_Carvalho](https://discourse.vtk.org/u/Paulo_Carvalho)
#### Post date: [August 12, 2020, 12:18pm UTC](https://discourse.vtk.org/t/visualization-of-2d-height-point-data/3951/4 "2020-08-12T12:18:04Z")
Hello, friend,
Please, take a look at this code: [https://github.com/PauloCarvalhoRJ/gammaray/blob/master/viewer3d/view3dbuilders.cpp](https://github.com/PauloCarvalhoRJ/gammaray/blob/master/viewer3d/view3dbuilders.cpp) . Look for a method called `buildForSurfaceCartesianGrid2D()`. A 2D Cartesian grid is exactly an array of values like yours. This will build a surface from your data.
regards,
Paulo
---
### Author:  [@amaclean](https://discourse.vtk.org/u/amaclean)
#### Post date: [August 13, 2020, 7:26am UTC](https://discourse.vtk.org/t/visualization-of-2d-height-point-data/3951/5 "2020-08-13T07:26:00Z")
You could try something like this: [InterpolateMeshOnGrid](https://lorensen.github.io/VTKExamples/site/Cxx/PolyData/InterpolateMeshOnGrid/). I’m pretty sure the gridActor is the one you want. So comment out the line:
```auto
renderer->AddActor(randomActor);
```
The `randomActor` is just the surface.
Comment out:
```auto
gridActor->GetProperty()->SetColor(0.0, 0.0, 1.0); //(R,G,B)
```
and set:
```auto
gridMapper->ScalarVisibilityOn();
```
This will give you a rather garish default height map. You can improve this by using color maps etc.
Once you are happy with what you are doing, look at a really complex example: [ElevationBandsWithGlyphs](https://lorensen.github.io/VTKExamples/site/Cxx/Visualization/ElevationBandsWithGlyphs/)