# vtkPlotSurface status
**URL:** https://discourse.vtk.org/t/vtkplotsurface-status/426
**Category:** Support
**Created:** [March 7, 2019, 1:00pm UTC](https://discourse.vtk.org/t/vtkplotsurface-status/426 "2019-03-07T13:00:05Z")
**Posts on this page:** 3
**Page:** 1
### Author:  [@infinnovation-dev](https://discourse.vtk.org/u/infinnovation-dev)
#### Post date: [March 7, 2019, 1:00pm UTC](https://discourse.vtk.org/t/vtkplotsurface-status/426/1 "2019-03-07T13:00:05Z")
I came across VTK when looking for an easy way to view data from a
data acquisition system I’m writing. Plus points were python bindings, interaction capability, and that it is already packaged for both Ubuntu/Debian and Scientific Linux. In particular, vtkPlotSurface / vtkChartXYZ seemed to be just what I wanted. I contributed a [Python version](https://github.com/lorensen/VTKExamples/pull/494) of the example. Then I discovered that the axis and clipping geometry [is broken](https://gitlab.kitware.com/vtk/vtk/issues/17542).
On further examination it appears (though I may be mistaken) that a simple vtkPlotSurface / vtkChartXYZ combination allows neither the axis labels to be set to other than X,Y,Z, nor for the colour scheme to be changed from the default spectrum.
So I’m left wondering if anyone has ever actually used these classes in anger. Is there an alternative surface plot implementation (perhaps in a related library) that I would be better off looking at?
---
### Author:  [@banesullivan](https://discourse.vtk.org/u/banesullivan)
#### Post date: [March 9, 2019, 7:36am UTC](https://discourse.vtk.org/t/vtkplotsurface-status/426/2 "2019-03-09T07:36:42Z")
> [@infinnovation-dev](#):
>
> allows neither the axis labels to be set to other than X,Y,Z, nor for the colour scheme to be changed from the default spectrum.
You should be able to change these properties… perhaps provide example code where you are experiencing trouble setting these properties for the community to see what’s not working and provide a solution as these plotting routines can get quite complicated.
> [@infinnovation-dev](#):
>
> Is there an alternative surface plot implementation (perhaps in a related library) that I would be better off looking at?
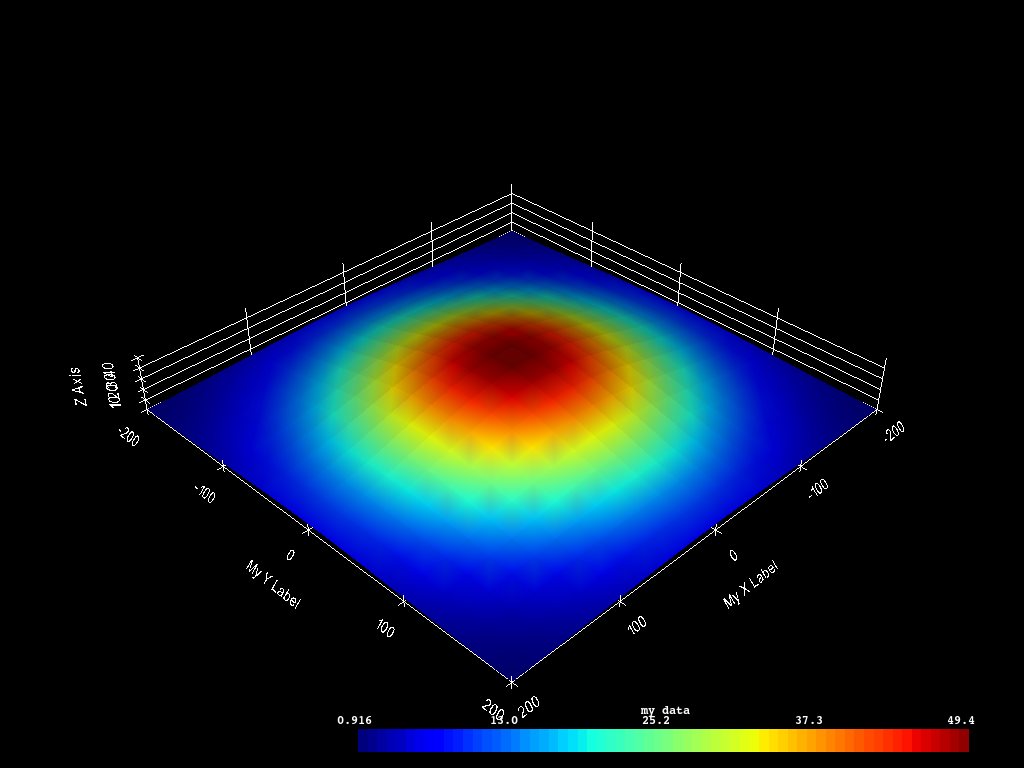
If you’re using Python and want an easier way to have control over renderings and more immediate access to VTK data structures, then you should check out [`vtki`](http://docs.vtki.org/en/latest/). It makes creating surface plots, integrated renderings and setting properties like axes labels a bit more intuitive. `vtki` is technically VTK at its core so it should be able to easily integrate into all your current workflows
```python
import vtki
import numpy as np
vtki.rcParams['background'] = 'black'
xx, yy = np.meshgrid(np.linspace(-200,200,20), np.linspace(-200,200,20))
b = 100
A = 50
zz = A*np.exp(-0.5*((xx/b)**2. + (yy/b)**2.))
grid = vtki.StructuredGrid(xx, yy, zz)
grid.point_arrays['my data'] = zz.ravel()
p = vtki.Plotter()
p.add_mesh(grid, cmap='jet')
p.show_grid(xlabel='My X Label', ylabel='My Y Label')
p.show()
```
---
### Author:  [@infinnovation-dev](https://discourse.vtk.org/u/infinnovation-dev)
#### Post date: [March 11, 2019, 1:07pm UTC](https://discourse.vtk.org/t/vtkplotsurface-status/426/3 "2019-03-11T13:07:33Z")
Thanks for the pointer to vtki - looks awesome.