# vtkVolume can color mapping?
**URL:** https://discourse.vtk.org/t/vtkvolume-can-color-mapping/1207
**Category:** Support
**Created:** [June 25, 2019, 7:35am UTC](https://discourse.vtk.org/t/vtkvolume-can-color-mapping/1207 "2019-06-25T07:35:57Z")
**Posts on this page:** 9
**Page:** 1
### Author:  [@Script\_K](https://discourse.vtk.org/u/Script_K)
#### Post date: [June 25, 2019, 7:35am UTC](https://discourse.vtk.org/t/vtkvolume-can-color-mapping/1207/1 "2019-06-25T07:35:57Z")
now i making pI’m creating a program that overlays two objects and prints one object with color mapping based on the coordinate values.
The overlay output was successful, but I could not find a way to do color mapping.
I output two objects using vtkVolume. However, the problem is that I can not extract the value corresponding to the coordinates of the object to be color-mapped in vtkVolume. How do I do color mapping to a volume? Thank you very much for your answers.
```auto
import vtk
import nrrd
import numpy as np
from vtk.util import numpy_support as VN
renWin = vtk.vtkRenderWindow()
renderer = vtk.vtkRenderer()
renWin.AddRenderer(renderer)
iren = vtk.vtkRenderWindowInteractor()
iren.SetRenderWindow(renWin)
lstVolume = []
reader = vtk.vtkNrrdReader()
reader.SetFileName('sample_nrrd.nrrd')
reader.Update()
vol = ImageDataToVolume(reader.GetOutput())
lstVolume.append(vol)
renderer.AddVolume(vol)
reader1 = vtk.vtkNrrdReader()
reader1.SetFileName('Segmentation-label_2.nrrd')
reader1.Update()
scalar = GetScalarData(reader1)
print(scalar)
vol1 = ImageDataToVolume(reader1.GetOutput())
lstVolume.append(vol1)
renderer.AddVolume(vol1)
iren.Initialize()
renWin.Render()
iren.Start()
def ImageDataToVolume(imagedata):
mapper = vtk.vtkSmartVolumeMapper()
mapper.SetInputData(imagedata)
vol = vtk.vtkVolume()
vol.SetMapper(mapper)
ApplyAutoVolumeProperty(imagedata, mapper, vol)
return vol
def GetScalarData(ptData):
vtkDataArray = ptData.GetScalars()
if vtkDataArray == None:
return np.array([])
sData = VN.vtk_to_numpy(vtkDataArray)
return sData
def ApplyAutoVolumeProperty(pData, pMapper, pVolume):
scalar = GetScalarData(pData.GetPointData())
min_value = -1000
max_value = 3095
fCenter = (max_value - min_value) / 2.0
fWidth = max_value - min_value
fLow = fCenter - fWidth / 2.0
fHigh = fCenter + fWidth / 2.0
fTerm = fHigh - fLow;
print("min, max : " + str(min_value) + ", " + str(max_value))
pMapper.SetBlendModeToComposite()
volProperty = vtk.vtkVolumeProperty()
volProperty.ShadeOn()
volProperty.SetInterpolationTypeToLinear()
volProperty.SetDiffuse(0.7)
volProperty.SetAmbient(0.2)
volProperty.SetSpecular(0.3)
volProperty.SetSpecularPower(30.0)
otf = vtk.vtkPiecewiseFunction()
otf.AddPoint(fLow, 0.0) # start
otf.AddPoint(fHigh, 1.0) # end
volProperty.SetScalarOpacity(0, otf)
ctf = vtk.vtkColorTransferFunction()
ctf.AddRGBPoint(fLow + fTerm * 0 * 0.2, 0.0, 0.0, 0.0)
ctf.AddRGBPoint(fLow + fTerm * 1 * 0.2, 0.7, 0.4, 0.1)
ctf.AddRGBPoint(fLow + fTerm * 2 * 0.2, 0.6, 0.5, 0.3)
ctf.AddRGBPoint(fHigh, 1.0, 1.0, 1.0)
volProperty.SetColor(0, ctf)
pVolume.SetProperty(volProperty)
pass
if __name__ == ' __main__':
main()
```
---
### Author:  [@marcomusy](https://discourse.vtk.org/u/marcomusy)
#### Post date: [June 25, 2019, 7:35pm UTC](https://discourse.vtk.org/t/vtkvolume-can-color-mapping/1207/2 "2019-06-25T19:35:11Z")
Consider using the [vtkplotter](https://github.com/marcomusy/vtkplotter) helper module, which greatly simplifies it ito:
```python
from vtkplotter import datadir, load, show
# note that vol1 is a vtkVolume:
vol1 = load(datadir+'vase.vti').mode(0) # can read .nrrd
vol1.alpha([0,0,0,0.5,0.5,0.6]) # opacity transfer func on the scalar range
vol1.color(['red','g', (1,0,1)]) # color transfer func
vol2 = load(datadir+'vase.vti').mode(1).addPos(60,0,0)
vol2.alpha([0,0,1,1])
vol2.color(['r','g', (0,0,1)])
show(vol1, vol2, bg='white', axes=True)
```
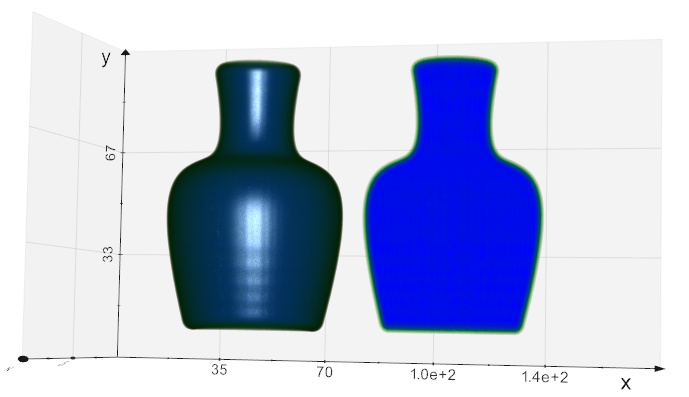
check out e.g. [this](https://github.com/marcomusy/vtkplotter/blob/master/examples/volumetric/read_vti.py) for a longer explanation.
---
### Author:  [@Script\_K](https://discourse.vtk.org/u/Script_K)
#### Post date: [June 25, 2019, 11:50pm UTC](https://discourse.vtk.org/t/vtkvolume-can-color-mapping/1207/3 "2019-06-25T23:50:13Z")
Thanks for reply!
I want to ask something. I want to do color mapping based on the coordinate values in the nrrd file. Can vtkplotter use such features?
And How Can i print original object colors
---
### Author:  [@marcomusy](https://discourse.vtk.org/u/marcomusy)
#### Post date: [June 26, 2019, 10:49am UTC](https://discourse.vtk.org/t/vtkvolume-can-color-mapping/1207/4 "2019-06-26T10:49:52Z")
it is not very clear to me what are you really trying to visualize… maybe you wish to isosurface your volume, and only then color the resulting mesh based on its coordinates… (?)
---
### Author:  [@Script\_K](https://discourse.vtk.org/u/Script_K)
#### Post date: [June 26, 2019, 11:38pm UTC](https://discourse.vtk.org/t/vtkvolume-can-color-mapping/1207/5 "2019-06-26T23:38:18Z")
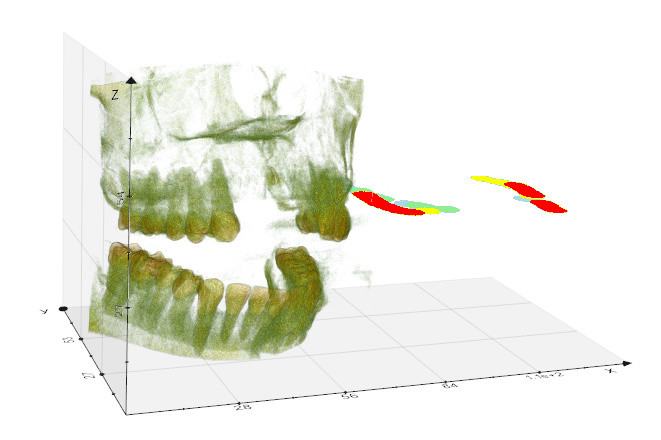
I currently use two nrrd files as shown.
The object on the right outputs the original color value, but the object on the left does not output the original color.
I did not set the color value separately and only adjusted Opacity.
> from dot import \*
> import vtk
> import dot
> from vtkplotter import \*
> def main():
> vol1 = load(‘Segmentation-label\_2.nrrd’).mode(1).addPos(60,0,0)
>
> ```
> vol1.alpha([0, 1, 1, 1, 1]) # opacity transfer func on the scalar range
>
> vol2 = load('sample_nrrd.nrrd').mode(0)
> vol2.alpha([0,0,0,0.4,0]) # opacity transfer func on the scalar range
>
> show(vol1,vol2, bg='white',axes=True)
>
> ```
>
> if **name** == ‘ **main** ’:
> main()
---
### Author:  [@marcomusy](https://discourse.vtk.org/u/marcomusy)
#### Post date: [June 27, 2019, 12:07am UTC](https://discourse.vtk.org/t/vtkvolume-can-color-mapping/1207/6 "2019-06-27T00:07:06Z")
I may be missing something but the expression “original color” has no meaning: there is no original color. There is a scalar associated to the volume and you can use this scalar to colorize the volume the way you like…
I’m afraid I cannot help you without having access to the data.
---
### Author:  [@Script\_K](https://discourse.vtk.org/u/Script_K)
#### Post date: [June 27, 2019, 1:16am UTC](https://discourse.vtk.org/t/vtkvolume-can-color-mapping/1207/7 "2019-06-27T01:16:22Z")
I understand your words. Finally, I want to ask. Is it possible to access the values of each voxel instead of changing the entire color of one object, and simply change the color?
---
### Author:  [@marcomusy](https://discourse.vtk.org/u/marcomusy)
#### Post date: [June 27, 2019, 9:59am UTC](https://discourse.vtk.org/t/vtkvolume-can-color-mapping/1207/8 "2019-06-27T09:59:29Z")
Hi,yes …but this is what `vol1.color([...])` is already doing: you assign a specific color that you choose to a specific range that you choose of the scalar.
E.g. say that your voxel scalar runs from -3 to 6 and you want -3 to show red and 1.5 violet and 6 green, then just set:
`vol1.color(['red', 'violet', 'green'])`
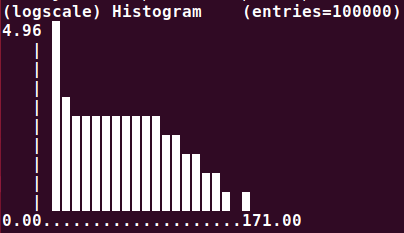
You can also print the histogram of your scalar with
`vol1.printHistogram(logscale=True)`, e.g.
---
### Author:  [@Script\_K](https://discourse.vtk.org/u/Script_K)
#### Post date: [June 27, 2019, 11:34pm UTC](https://discourse.vtk.org/t/vtkvolume-can-color-mapping/1207/9 "2019-06-27T23:34:07Z")
Thank you very much. Your kind reply was helpful!