# xyz big values points plot issue
**URL:** https://discourse.vtk.org/t/xyz-big-values-points-plot-issue/16095
**Category:** Support
**Tags:** code
**Created:** [October 15, 2025, 1:01pm UTC](https://discourse.vtk.org/t/xyz-big-values-points-plot-issue/16095 "2025-10-15T13:01:02Z")
**Posts on this page:** 9
**Page:** 1
### Author:  [@Joaquin\_Opazo](https://discourse.vtk.org/u/Joaquin_Opazo)
#### Post date: [October 15, 2025, 1:01pm UTC](https://discourse.vtk.org/t/xyz-big-values-points-plot-issue/16095/1 "2025-10-15T13:01:02Z")
Hi all,
I’m currently working on creating meshings for a surface using Delaunay2D for triangulation, but I’ve encountered an issue while reading the xyz points from my file. These are georeferenced points, so they actually represent East, North, and Height. The points look like this:
```auto
...
553569.600 2867996.000 -0.508
553569.600 2867996.400 -0.508
553570.000 2867995.200 -0.508
553570.000 2867995.600 -0.586
553570.000 2867996.000 -0.508
553570.000 2867996.400 -0.508
553570.000 2867996.800 -0.508
553570.000 2867997.200 -0.428
553570.000 2867997.600 -0.344
...
```
Now, here’s the problem — if I use these points without any modification, when plotting them, they appear “grouped” along the X and Y axes in the VTK window. (I’ve attached all the images so you can better understand what I mean visually.)
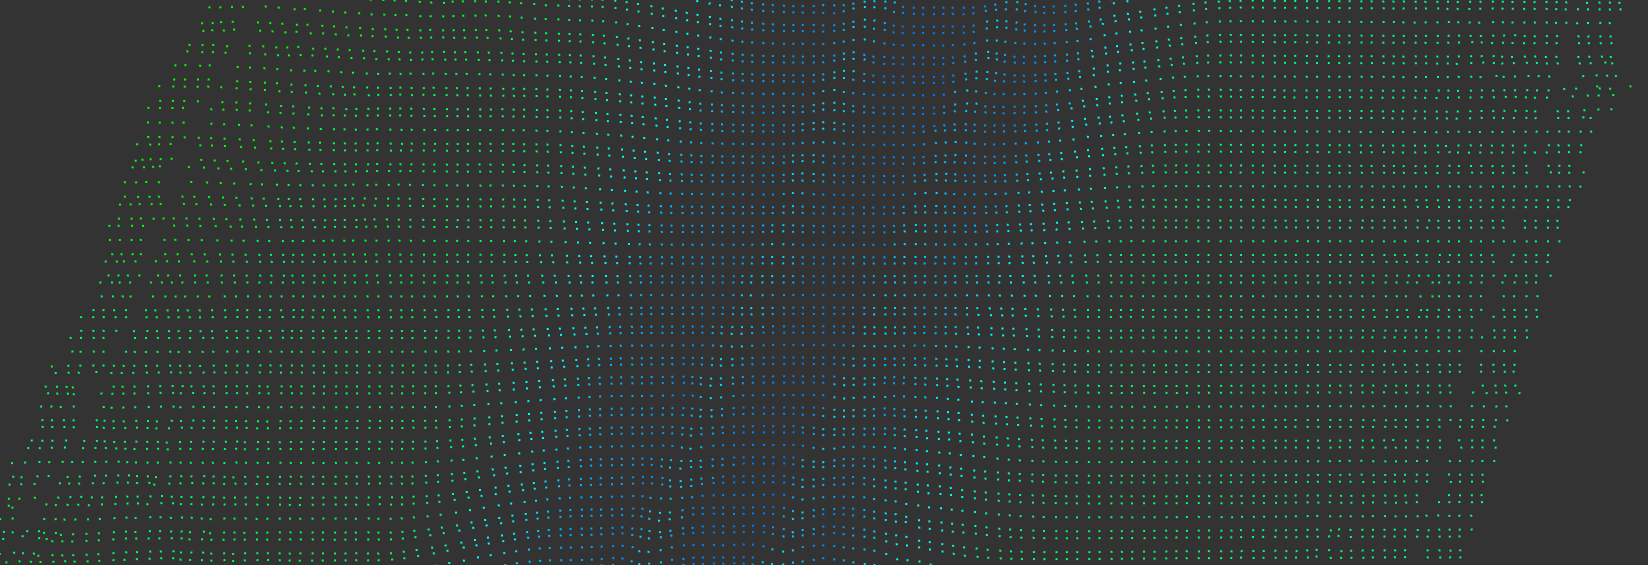
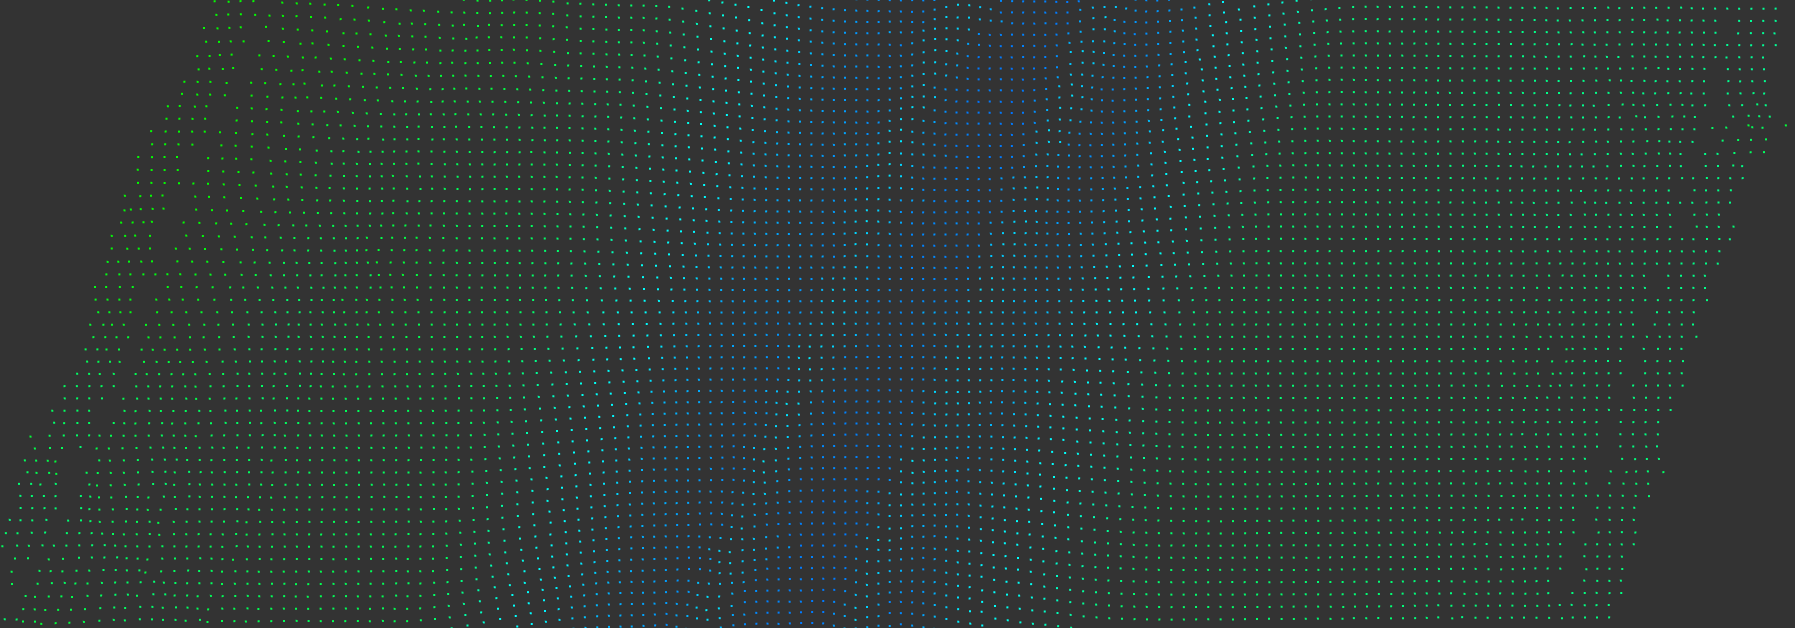
After several tests, I came up with the idea of translating my points to the centroid of the file and making that centroid the new (0,0) of the image. That significantly improved the issue. This improvement is clearly visible in the lines when generating the meshing.
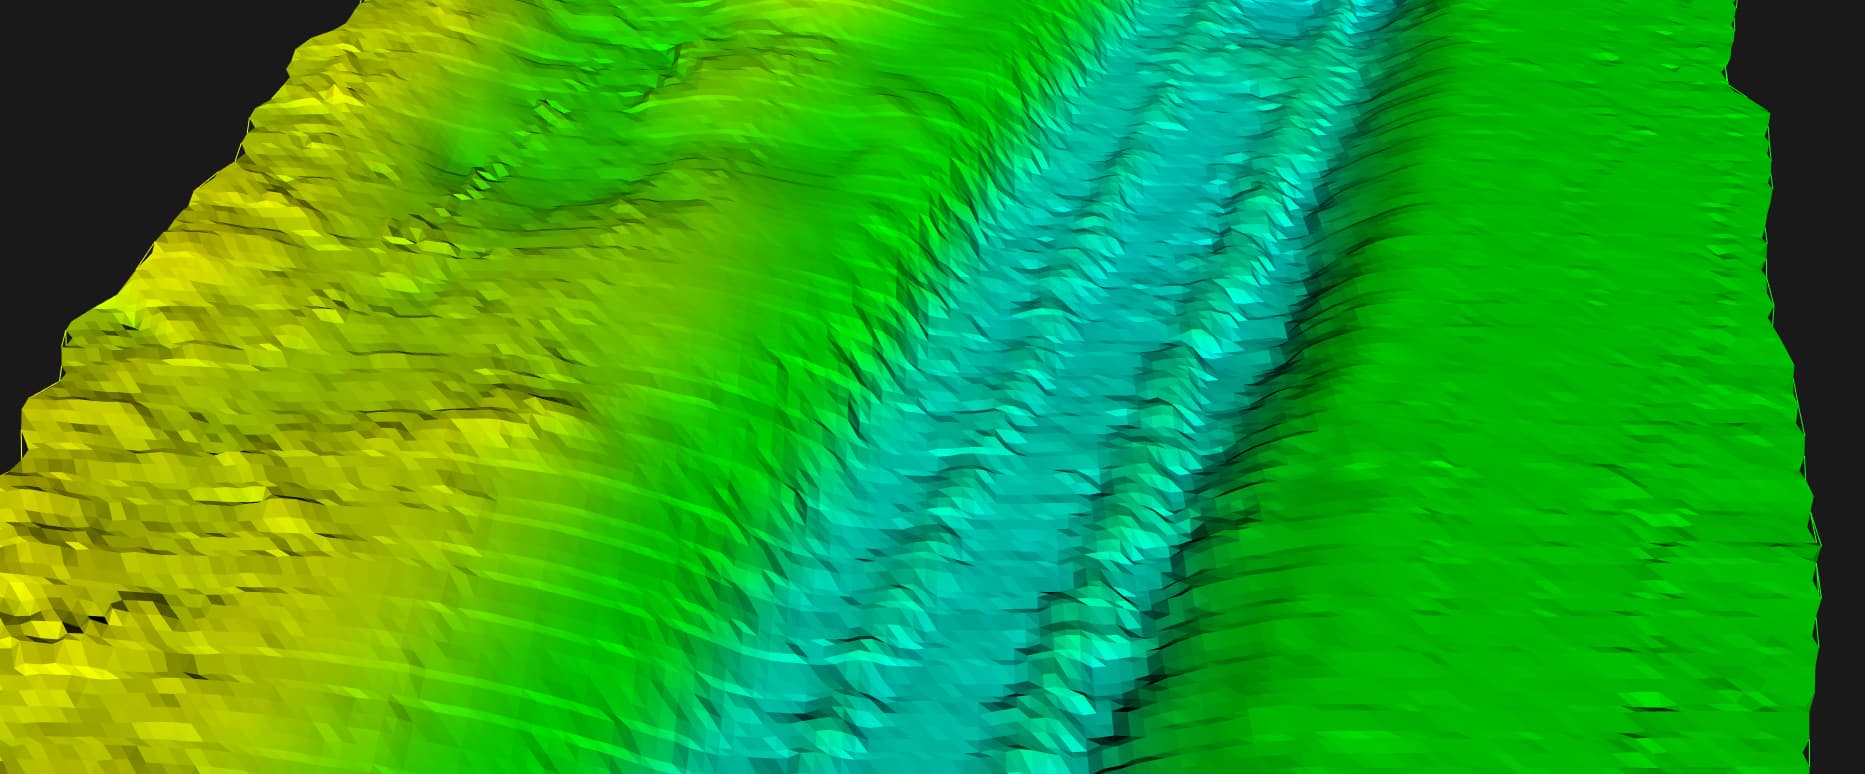
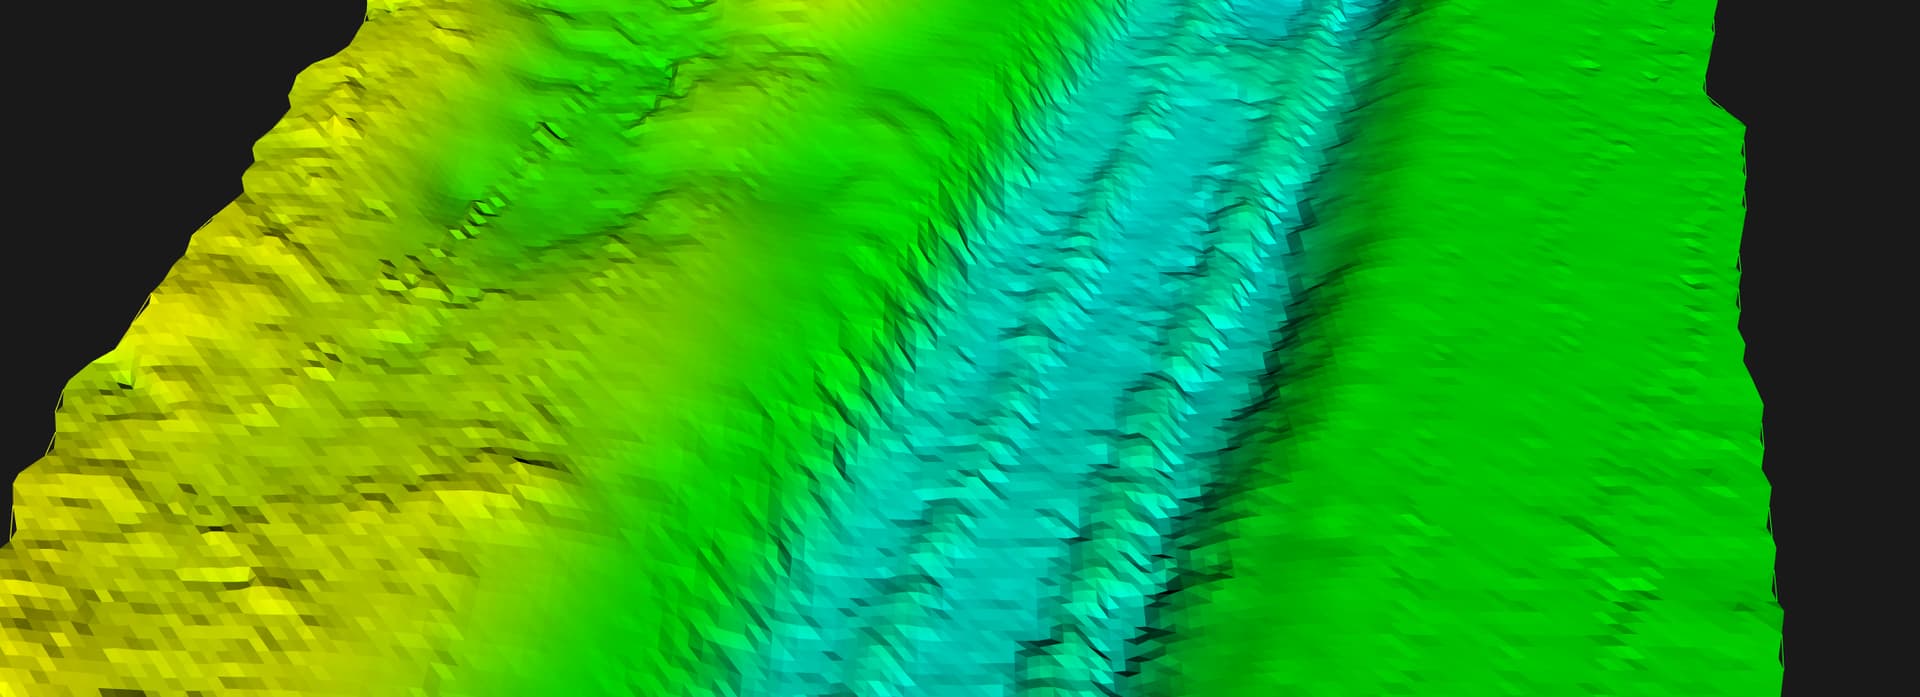
I’m still not sure whether this is a problem related to the magnitude of the values, the fact that they are georeferenced, or if I simply need to adjust something when creating the vtkPoints and later adding them to the vtkPolyData.
If anyone has any idea why this happens, I’d really appreciate it, even if it’s not a full solution.
Best Regards
---
### Author:  [@dgobbi](https://discourse.vtk.org/u/dgobbi)
#### Post date: [October 15, 2025, 3:46pm UTC](https://discourse.vtk.org/t/xyz-big-values-points-plot-issue/16095/2 "2025-10-15T15:46:10Z")
By default, VTK uses 32-bit floats for points, and 32-bit floats cannot precisely represent your data values because your data has too many significant digits. For example (using numpy):
```python
import numpy as np
# 2867996.4 cannot be exactly represented with float32
x = np.float32(2867996.4)
print(x)
2867996.5
# print a list of available float32 values
x = np.float32(2867996.000)
for i in range(4):
x = np.nextafter(x, np.inf, dtype=np.float32)
print(f"{x:.3f}")
2867996.250
2867996.500
2867996.750
2867997.000
```
In other words, the “grouping” occurs because your data points are being rounded to the closest 32-bit float. A good rule-of-thumb is to only use 32-bit floats for data that has fewer than 7 significant digits.
By subtracting the centroid, you are essentially reducing the number of significant digits used by your data.
There are ways to create data sets with double-precision in VTK, e.g. `vtkPoints::SetDataTypeToDouble()`, but you would still run into this precision issue on the GPU itself, since GPUs use 32-bit floats for rendering.
Subtracting the centroid is a very reasonable solution to this problem, I don’t know of any “quick fix” provided by VTK itself, since this is a numerical precision issue.
---
### Author:  [@cory.quammen](https://discourse.vtk.org/u/cory.quammen)
#### Post date: [October 15, 2025, 5:22pm UTC](https://discourse.vtk.org/t/xyz-big-values-points-plot-issue/16095/3 "2025-10-15T17:22:25Z")
You can get automated shifting and scaling within the `vtkPolyDataMapper` itself by calling `SetVBOShiftScaleMethod()` and setting it to one of the [ShiftScaleMethodType](https://vtk.org/doc/nightly/html/classvtkPolyDataMapper.html#a4d69f4bae86a6e58182381d102ba03fe) enum values. `AUTO_SHIFT` is perhaps what you would want to use here to effectively subtract the centroid under the hood without needing to transform your data.
Other shift/scale options are:
`DISABLE_SHIFT_SCALE`: Do not shift/scale point coordinates. Ever!
`AUTO_SHIFT_SCALE`: The default, automatic computation.
`ALWAYS_AUTO_SHIFT_SCALE`: Always shift scale using auto computed values.
`MANUAL_SHIFT_SCALE`: Manual shift/scale (for use with AppendVBO)
`NEAR_PLANE_SHIFT_SCALE`: Shift scale based on camera settings.
`FOCAL_POINT_SHIFT_SCALE`: Shift scale based on camera settings.
---
### Author:  [@Joaquin\_Opazo](https://discourse.vtk.org/u/Joaquin_Opazo)
#### Post date: [October 16, 2025, 7:32am UTC](https://discourse.vtk.org/t/xyz-big-values-points-plot-issue/16095/4 "2025-10-16T07:32:52Z")
Thank you very much for taking the time to explain everything to me. The problem is now perfectly clear, and I’ll test in the code what Cory mentioned.
Have a great day!
---
### Author:  [@Joaquin\_Opazo](https://discourse.vtk.org/u/Joaquin_Opazo)
#### Post date: [October 16, 2025, 8:35am UTC](https://discourse.vtk.org/t/xyz-big-values-points-plot-issue/16095/5 "2025-10-16T08:35:54Z")
I just tested the proposed solution, and unfortunately, it doesn’t change anything when plotting the points.
I tried with the following points, comparing the manual method of calculating and subtracting the new centroid versus VBOShifting.
```auto
...
556051.04 2869514.62 -8.4533
556051.04 2869514.63 -8.5128
556051.08 2869514.73 -8.5127
556051.10 2869514.79 -8.5148
556051.12 2869514.84 -8.4284
556051.17 2869514.96 -8.4923
556051.20 2869515.04 -8.4860
556051.21 2869515.07 -8.4980
...
```
Manual Shifting:
```auto
open file stream with filename
while there are lines in the file:
read the next line
parse the line into x, y, z values
if parsing succeeds:
add {x, y, z} to tempPoints
// Calculate the centroid (average position)
initialize origin as {0.0, 0.0, 0.0}
for each point in tempPoints:
add point.x to origin.x
add point.y to origin.y
add point.z to origin.z
if tempPoints is not empty:
divide origin.x by number of points in tempPoints
divide origin.y by number of points in tempPoints
divide origin.z by number of points in tempPoints
for each point in tempPoints:
compute shifted as {point.x - origin.x, point.y - origin.y, point.z - origin.z}
insert the original point (point.x, point.y, point.z) into vtkpoints
insert point.z into z_values for coloring
```
What i basically want is to avoid the 3 loops my code. This are the difference at the VTK Window.
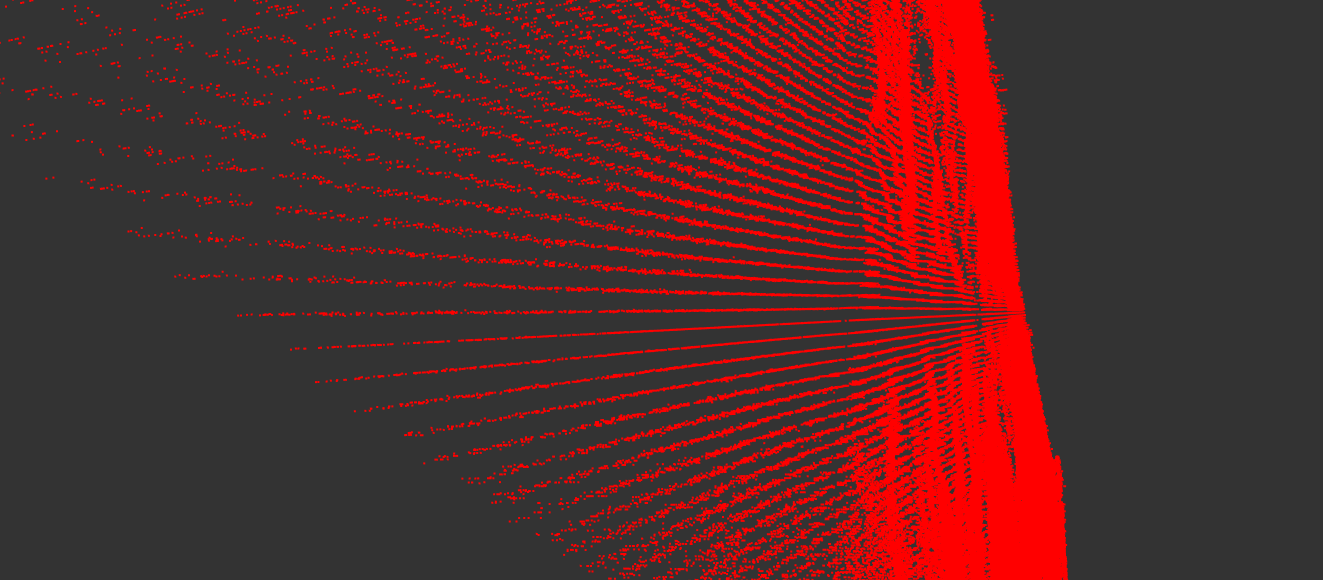
This image was taken with no Manual shifting and VBO set to _AUTO\_SHIFT_
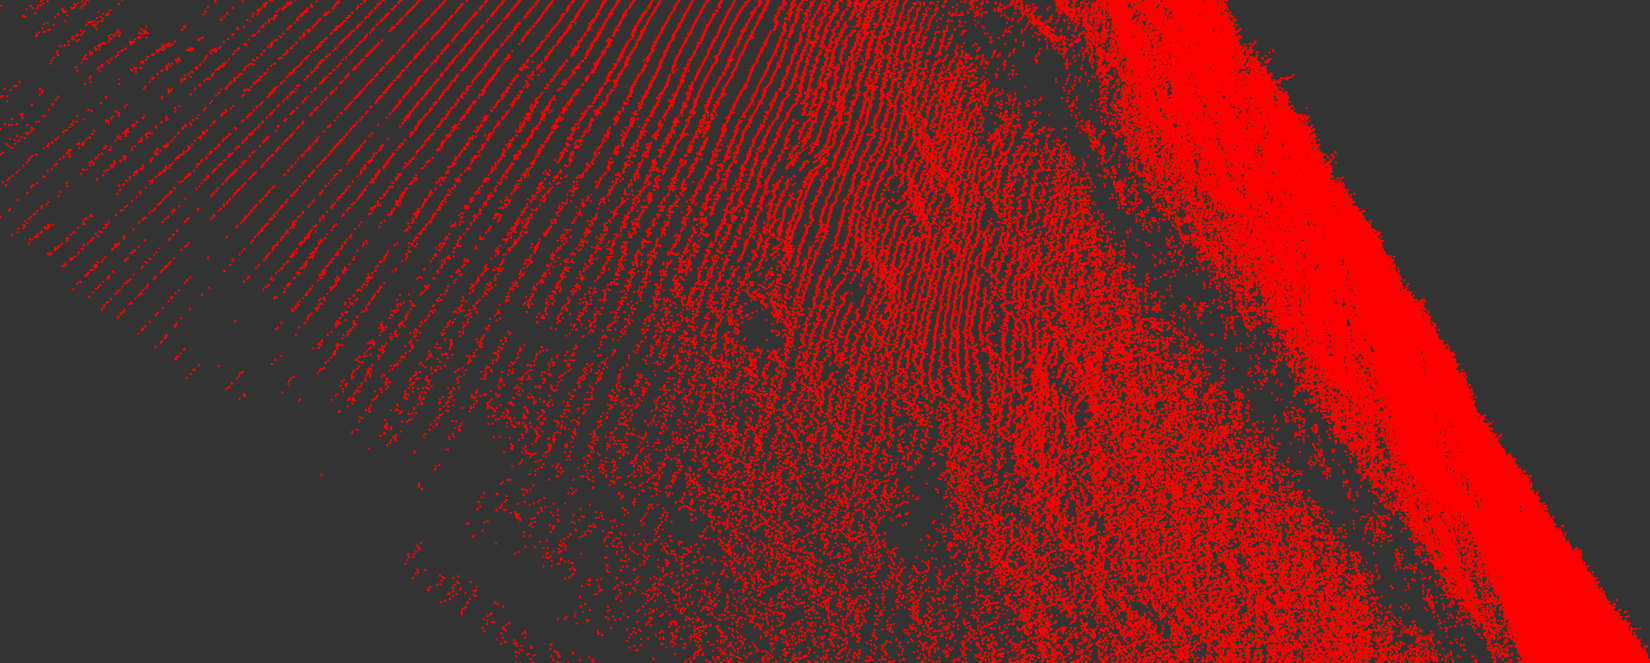
This image was with Manual shifting and no SetVBO method.
Any thoughts are welcome 🙂
---
### Author:  [@cory.quammen](https://discourse.vtk.org/u/cory.quammen)
#### Post date: [October 16, 2025, 1:31pm UTC](https://discourse.vtk.org/t/xyz-big-values-points-plot-issue/16095/6 "2025-10-16T13:31:45Z")
How about with no manual shifting and VBO set to _AUTO\_SHIFT\_SCALE_?
---
### Author:  [@Joaquin\_Opazo](https://discourse.vtk.org/u/Joaquin_Opazo)
#### Post date: [October 16, 2025, 1:37pm UTC](https://discourse.vtk.org/t/xyz-big-values-points-plot-issue/16095/7 "2025-10-16T13:37:33Z")
Sadly is the same
```auto
In the output:
Get shift scale method: 1
```
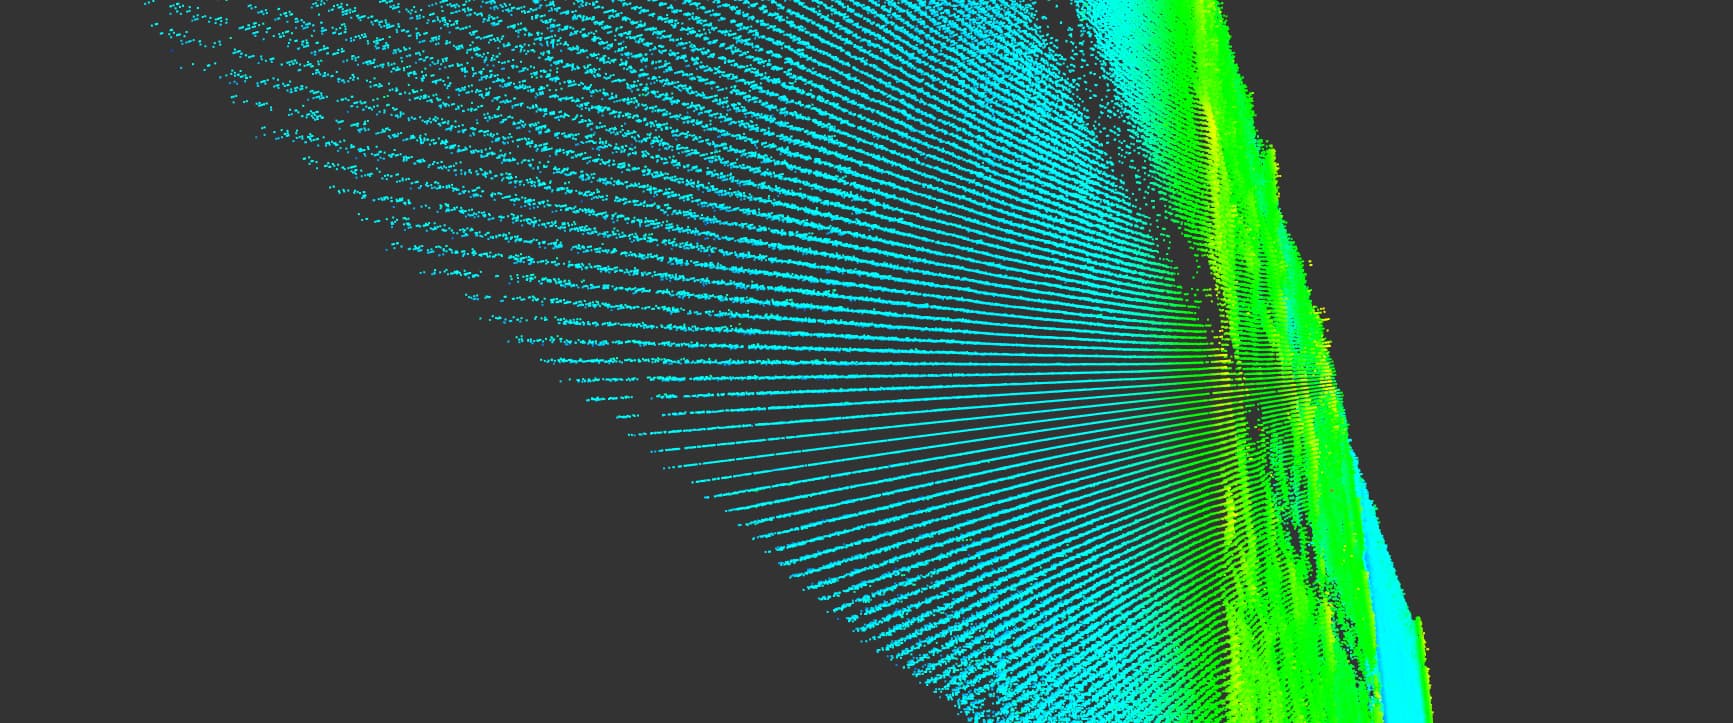
Just for context is the same data, just with z coloring.
---
### Author:  [@dgobbi](https://discourse.vtk.org/u/dgobbi)
#### Post date: [October 16, 2025, 1:47pm UTC](https://discourse.vtk.org/t/xyz-big-values-points-plot-issue/16095/8 "2025-10-16T13:47:26Z")
Just to be sure, are you calling `vtkpoints.SetDataTypeToDouble()` before inserting your points?
---
### Author:  [@Joaquin\_Opazo](https://discourse.vtk.org/u/Joaquin_Opazo)
#### Post date: [October 16, 2025, 2:35pm UTC](https://discourse.vtk.org/t/xyz-big-values-points-plot-issue/16095/9 "2025-10-16T14:35:22Z")
I just tested with the function you mentioned, and it works correctly without applying the VBO method. I’m not sure if it might cause any issues in the future, but for now it’s perfect.
Thank you very much.