Hello everyone! I think there are some problems with coloring the self-created Polydata, I need everyone’s help.
First,I only have point data and cell data in my Polydata data;
Here is part of the code
for (let edgeIdx = 0; edgeIdx < len; edgeIdx++) {
  for (let i = 0; i < 6; i++) {
    pointValues[pointValuesIndex] = data.edgelist[edgeIdx].vertex_coord[i];
    pointValuesIndex++;
  }
  cellValues[cellOffset++] = 2;
  cellValues[cellOffset++] = edgeIdx * 2 + 0;
  cellValues[cellOffset++] = edgeIdx * 2 + 1;
}

polydata.getPoints().setData(pointValues, 3);
polydata.getLines().setData(cellValues);

Second, I can render the vtp file according to GeometryViewer,and I customized my colormap, which can be displayed according to the color I choose and the Mapper range I set.
Here is part of the code
const preset = vtkColorMaps.getPresetByName('Turbo');
/**
preset.RGBPoints is to convert the value of 20 colors (rbg) from 255 to 0-1, which contains group of 4 (Colorindex, r, g, b)
*/
const scalarArray = new Uint32Array([...preset.RGBPoints, ...preset.RGBPoints, ...preset.RGBPoints, ...preset.RGBPoints, ...preset.RGBPoints, ...preset.RGBPoints, ...preset.RGBPoints, ...preset.RGBPoints, ...preset.RGBPoints, ...preset.RGBPoints,
...preset.RGBPoints, ...preset.RGBPoints, ...preset.RGBPoints, ...preset.RGBPoints, ...preset.RGBPoints, ...preset.RGBPoints, ...preset.RGBPoints, ...preset.RGBPoints, ...preset.RGBPoints, ...preset.RGBPoints,
...preset.RGBPoints, ...preset.RGBPoints, ...preset.RGBPoints, ...preset.RGBPoints, ...preset.RGBPoints, ...preset.RGBPoints, ...preset.RGBPoints, ...preset.RGBPoints, ...preset.RGBPoints, ...preset.RGBPoints, ...preset.RGBPoints,
...preset.RGBPoints, ...preset.RGBPoints, ...preset.RGBPoints, ...preset.RGBPoints, ...preset.RGBPoints, ...preset.RGBPoints, ...preset.RGBPoints, ...preset.RGBPoints, ...preset.RGBPoints, ...preset.RGBPoints,
...preset.RGBPoints, ...preset.RGBPoints, ...preset.RGBPoints, ...preset.RGBPoints, ...preset.RGBPoints, ...preset.RGBPoints, ...preset.RGBPoints, ...preset.RGBPoints, ...preset.RGBPoints, ...preset.RGBPoints,
]);
const table = vtkDataArray.newInstance({
  name: 'color',
  values: scalarArray,
  numberOfComponents: 4
});
const lookupTable = vtkColorTransferFunction.newInstance();

const mapper = vtkMapper.newInstance({
  interpolateScalarsBeforeMapping: false,
  useLookupTableScalarRange: true,
  lookupTable,
  scalarVisibility: false,
});

mapper.set({
  colorByArrayName: "color",
  interpolateScalarsBeforeMapping: true,
  colorMode: ColorMode.MAP_SCALARS,
  scalarMode: ScalarMode.USE_POINT_DATA,
  scalarVisibility: true,
});
lookupTable.applyColorMap(preset);
lookupTable.setMappingRange(-0.6, 3);
lookupTable.updateRange();
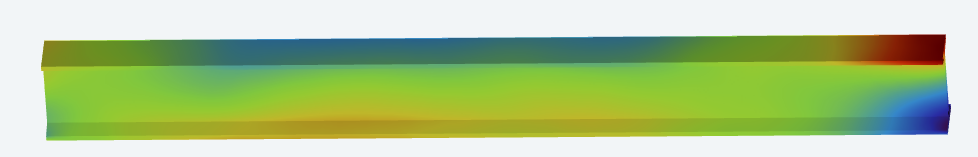
Then, But I found a problem, the number of my scalars (group of 4 (index, r, g, b)) must be equal to the number of vertices (group of three (x, y, z)), in order to be able to render all;
Here are two comparison pictures:
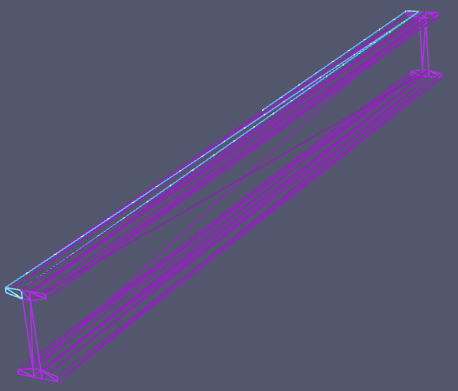
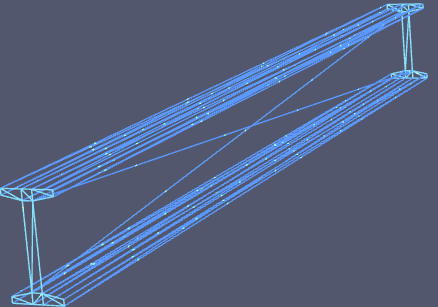
I don’t know the reason for this, I hope you can give me some suggestions.
Next,This is the color effect I expect (rendering the vtp file), but I set the same value and range and it does not achieve the effect (ignoring the complex mesh inside).
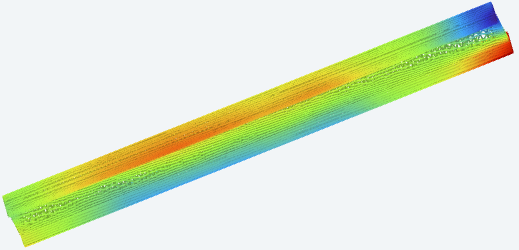
(Tip:The setting of arrays in VTK.JS is also very critical, such as Uint8Array, Float32Array, etc.)
Last,To sum up, I have two questions:
- Why do I set the scalar in Polydata to be consistent with the number of vertices before rendering all (this is inconsistent with vtp rendering)
- How should I control mapper or other variables to render the result the same as in vtp
Looking forward to your suggestions