VTK is primarily a rasterization-focused visualiser but I’ve been making some progress on an exporter for making scientific figures that can be used in publications. Typically scientific journals expect vector graphics (especially for axes) however AFAIK the CubeAxesActor doesn’t directly export when using the SVGExporter as it’s not really a 2D Actor. When writing documents in Latex it’s often preferable to use PGF/Tikz for plots & diagrams due to their compatibility with the compiler which isn’t directly supported by VTK.
The vtkCubeAxesActor has some interesting quirks; when using 3D labels the text becomes challenging to read at oblique angles and can look illegible at lower resolutions, when using the 2D labels the labels remain readable but their positions can drift pretty wildly from the axis and labels often end up inside the axes for some reason.

Because of this I decided to try and export the rendered scene with the axes disabled and use it as an overlay with Matplotlib constructing equivalent axes. There’s still a little work that needs to be done to get the two representations to be equivalent (mainly the camera rotation, axes colors, overlay size) but it’s pretty close to what’s expected.
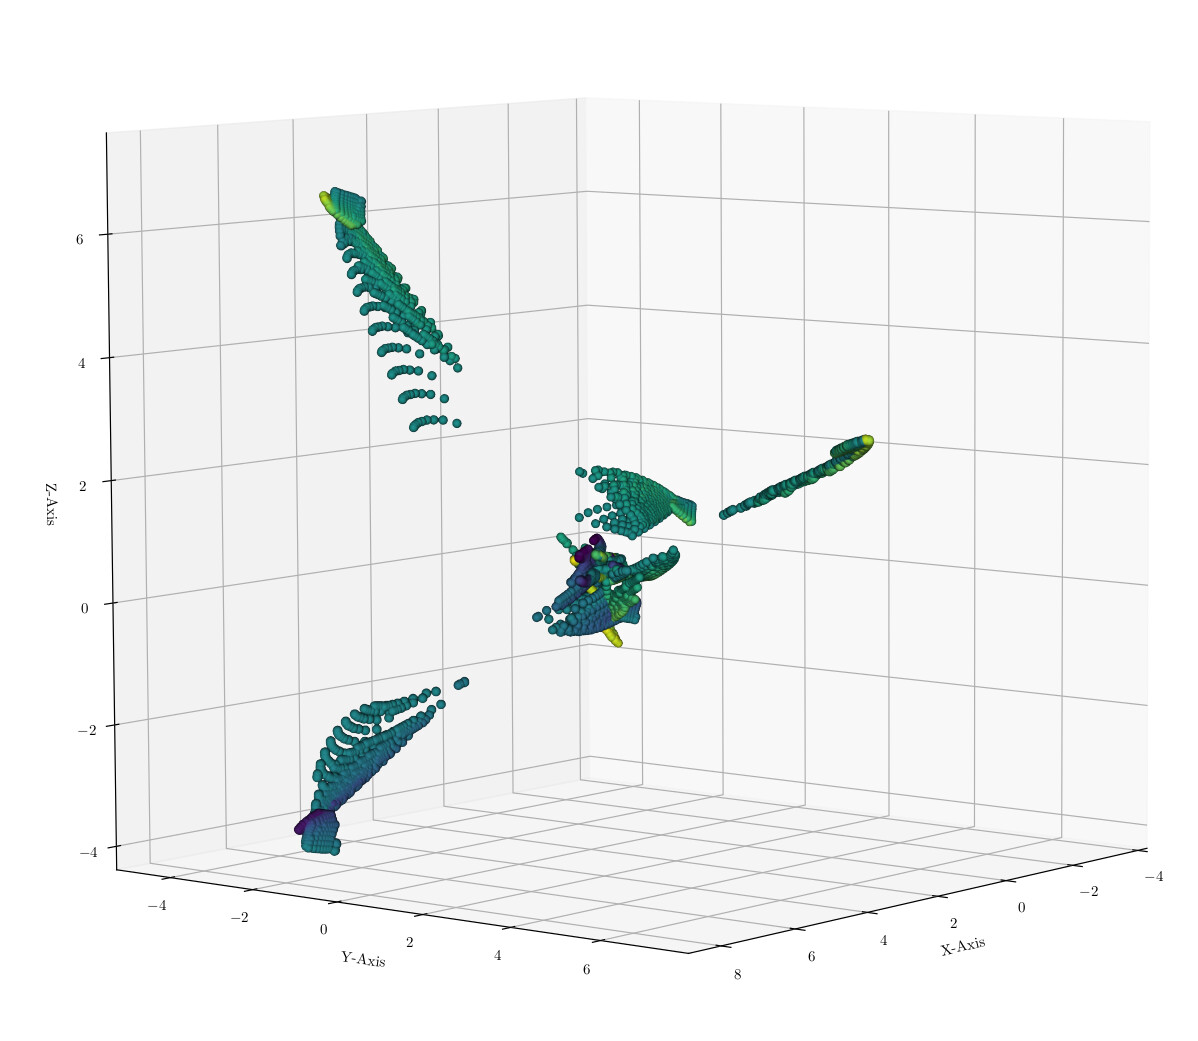
I’ve attached a pdf version that illustrates the benefits of vector graphics axes along with the relevant pgf file here:
example_pgf_figure.pdf (2.8 MB)
mpl.pgf (25.2 KB)
The code I used for exporting is shown below, it still needs work but I figured it might prompt some discussion.
    filetype == 'pgf':

        tempname = 'temp_overlay.png'
        render_scale = 4

        renderer = source.GetRenderers().GetFirstRenderer()
        renderer.SetBackgroundAlpha(0.0)
        renderer.GradientBackgroundOff()
        renderer.SetUseDepthPeeling(1)
        renderer.SetOcclusionRatio(0)
        renderer.Modified()
        source.SetAlphaBitPlanes(1)
        source.Modified()

        dpi = source.GetDPI()
        actual_size = source.GetActualSize()

        physical_size = np.asarray(actual_size)/dpi

        total_3D_actors = renderer.GetActors().GetNumberOfItems()

        actors = renderer.GetActors()

        for i in range(total_3D_actors):
            actor = actors.GetItemAsObject(i)

            if isinstance(actor, vtk.vtkCubeAxesActor):

                actor.SetVisibility(False)


        if verbose:
            print('writing PGF to %s' % savename)
        w2if = vtk.vtkWindowToImageFilter()
        w2if.SetInputBufferTypeToRGBA()
        w2if.SetScale(render_scale)
        w2if.SetInput(source)
        w2if.ReadFrontBufferOff()
        w2if.Update()
        if verbose:
            print('writing data to %s, upscaled by %d' % (savename, render_scale))
        writer = vtk.vtkPNGWriter()
        writer.SetFileName(tempname)
        writer.SetInputData(w2if.GetOutput())
        writer.Write()

        im = imread(tempname)

        for i in range(total_3D_actors):

                actor = renderer.GetActors().GetItemAsObject(i)

                if isinstance(actor, vtk.vtkCubeAxesActor):

                    xtitle = actor.GetXTitle()
                    ytitle = actor.GetYTitle()
                    ztitle = actor.GetZTitle()

                    axes_limits = np.asarray(actor.GetBounds())

                    axes_camera = actor.GetCamera()
                    axes_camera.OrthogonalizeViewUp()

                    direction_of_projection = axes_camera.GetViewPlaneNormal()
                    azimuth = direction_of_projection[0] * (180/np.pi)
                    elevation = direction_of_projection[1] * (180/np.pi)
                    roll = axes_camera.GetRoll()

                    camera_params = [azimuth, elevation, roll]

                    make_mpl_axes(axes_lims=axes_limits, xlabel=xtitle, ylabel=ytitle, zlabel=ztitle, im=im, figsize=physical_size, savename=savename, cam_params=camera_params)

                    actor.SetVisibility(True)


  def make_mpl_axes(axes_lims=[[0,1], [0,1], [0,1]], xlabel='X', ylabel='Y', zlabel='Z', savename='mpl.pgf', im=None, figsize=(6,6), cam_params=[30,30,30]):

      fig = plt.figure(figsize=figsize)
      ax = plt.axes(projection='3d', box_aspect=[1,1,1])

      ax.set_xlabel(xlabel)
      ax.set_ylabel(ylabel)
      ax.set_zlabel(zlabel)
      ax.set_xlim(axes_lims[0], axes_lims[1])
      ax.set_ylim(axes_lims[2], axes_lims[3])
      ax.set_zlim(axes_lims[4], axes_lims[5])

      ax.view_init(azim=cam_params[0], elev=cam_params[1], roll=cam_params[2])

      if im is not None:
          imax = fig.add_axes([0, 0, 1, 1])
          imax.set_axis_off()
          imax.imshow(im, aspect="equal")

      plt.tight_layout()
      plt.savefig(savename, dpi=600)
      plt.show()