I have a continuous legend created for my plot using the vtkScalarBarActor but I cannot see how to create one for discrete values.
I previously have used vtkLegendBoxActor when implementing in Python but I do not believe this is available in VTK.js?
Are there any examples online showing how this could be done?
I guess you need what is termed an annotaded lookup table. Here is how I do it in C++:
    //table color indexes must go from 0 to greatest category code, without skipping values
    size_t tableSize = greatestCategoryCode + 1;
    vtkSmartPointer<vtkLookupTable> lut = vtkSmartPointer<vtkLookupTable>::New();
    lut->SetNumberOfTableValues(tableSize);

    //assign only the codes defined in the category definition
    //which may be less than the total number of entries in the color table
    //this is a requirement by the way VTK's LUT work for categorical color tables
    for(size_t i = 0; i < tableSize; ++i)
    {
        if( cd->codeExists( i ) ){ //cd is a category definition table object of the application's domain
            double rgb[3];
            QColor color = cd->getCategoryColor( i );
            rgb[0] = color.redF();
            rgb[1] = color.greenF();
            rgb[2] = color.blueF();
            lut->SetTableValue(i, rgb[0], rgb[1], rgb[2], 1.0);
            lut->SetAnnotation(i, cd->getCategoryName( i ) );
        } else { //we can't skip values, so add some default annotation for non-existing codes
            lut->SetTableValue(i, 1.0, 0.0, 1.0, 0.3); //ilegal color codes are rendered as pink transparent.
            lut->SetAnnotation(i, "UNKNOWN CATEGORY" );
        }
    }
    lut->SetNanColor( 1.0, 0.0, 1.0, 0.3 ); //unvalued samples are likewise rendered as pink transparent.
    lut->IndexedLookupOn();
    lut->Build();
I think this is not difficult to port to JavaScript.
Thanks for the replies thus far but I could not yet get it functioning.
Ideally I would like my code to work for both continuous and categorical variables (depending on what scalars the user wants to colour by) and so would like to, if possible, use the same modules etc.
Is there some way to change the scalarBarActor to not show a full bar but only the colours at the selected points?
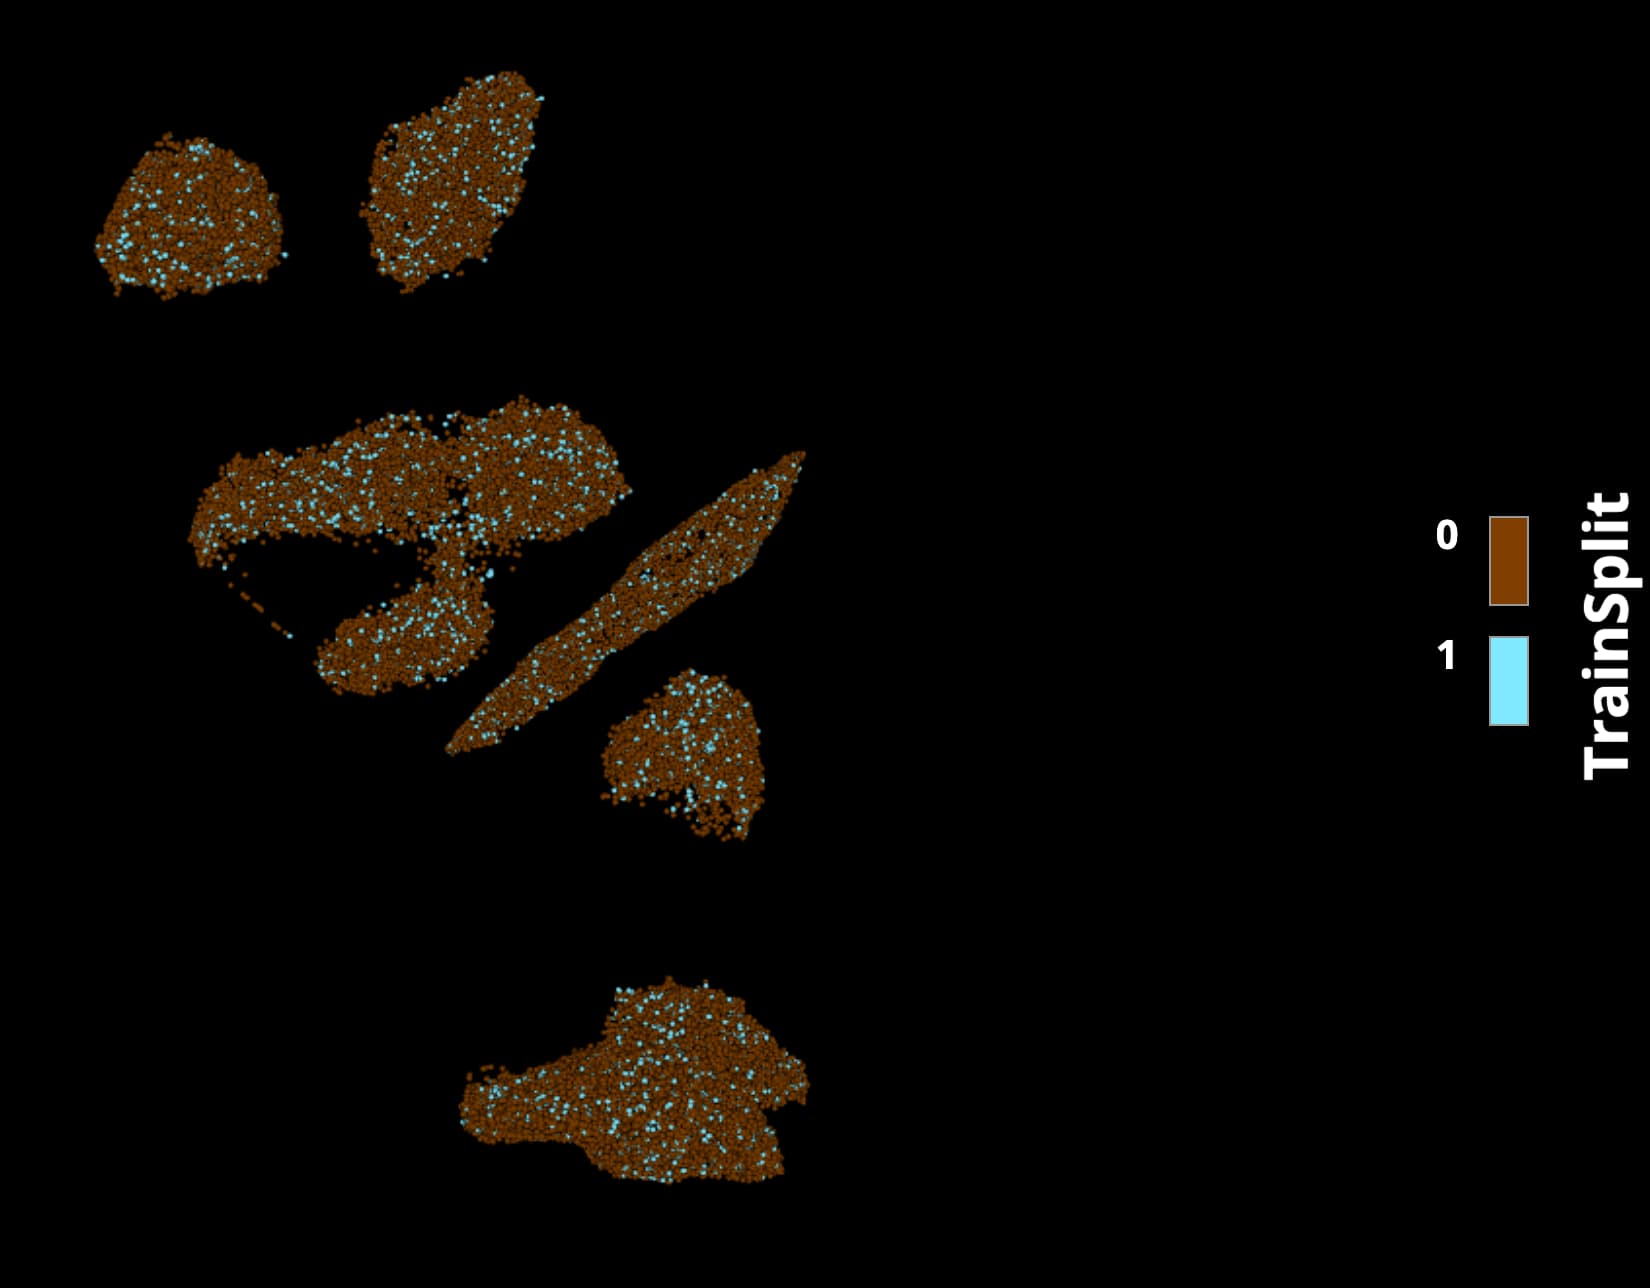
For the discrete instance, I am currently creating a vtkColorTransferFunction and setNumberOfValues to the number of unique points in the data. Then, for each unique value I am using addRGBPoint to add the colour to the current value in the table.
Below is snippits of the code being used: Note: Only code between /* DISCRETE CHANGES */ has been changed for discrete variables.
var lookupTable = vtk.Rendering.Core.vtkColorTransferFunction.newInstance();

const scalarArray = this.vtkData.getPointData().getArrayByName(colorByArrayName.toLowerCase());

/* DISCRETE CHANGES */
// Get unique values from the data
let unique = scalarArray.getData().filter(this.onlyUnique).sort()
// Set the number of values
lookupTable.setNumberOfValues(unique.length)

for (let index = 0; index < unique.length; index++) {

    lookupTable.addRGBPoint(unique[index],
                            rgb[0][index],   // 2D array of RGB values
                            rgb[1][index],
                            rgb[2][index]);
}
/* DISCRETE CHANGES */

this.mapper = vtk.Rendering.Core.vtkGlyph3DMapper.newInstance({
            colorByArrayName,
            colorMode: 1,  // vtk.Rendering.Core.Mapper.ColorMode.MAP_SCALARS;,
            interpolateScalarsBeforeMapping: true,
            scalarMode: 3, // vtk.Rendering.Core.Mapper.Constants.ScalarMode.USE_POINT_FIELD_DATA
            scalarVisibility: true,
            useLookupTableScalarRange: true,
            lookupTable,
        });

this.actor.setMapper(this.mapper);
this.mapper.setInputData(this.vtkData, 0)
this.mapper.setInputConnection(this.source.getOutputPort(), 1)

this.lutActor = vtk.Rendering.Core.vtkScalarBarActor.newInstance()
this.lutActor.setAxisLabel(colorByArrayName);
this.lutActor.setVisibility(true);
this.lutActor.setDrawNanAnnotation(false);
this.lutActor.setScalarsToColors(this.mapper.getLookupTable());

...
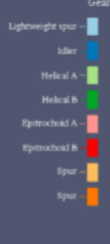
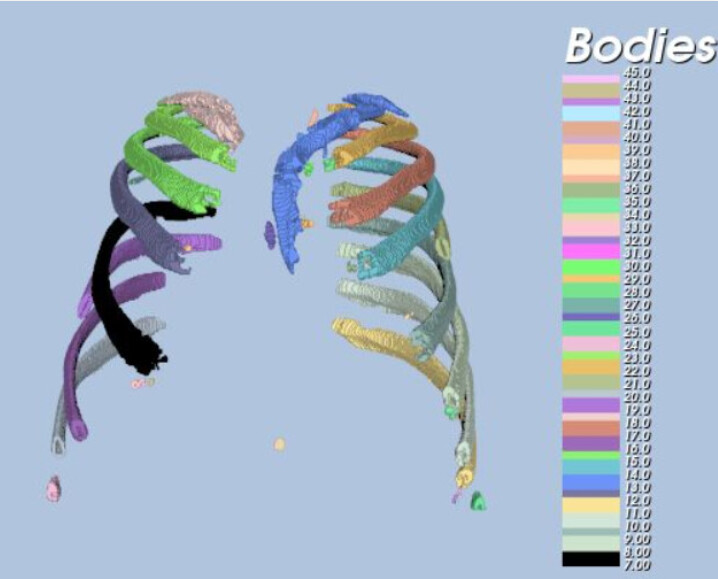
Ideally I am looking for something like this:
@Sebastien_Jourdain (only adding you as you have been very helpful in the past)
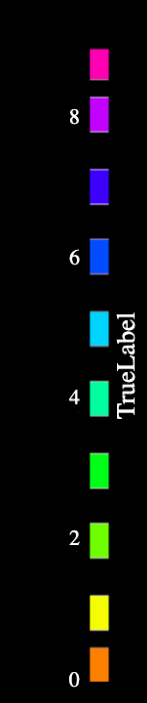
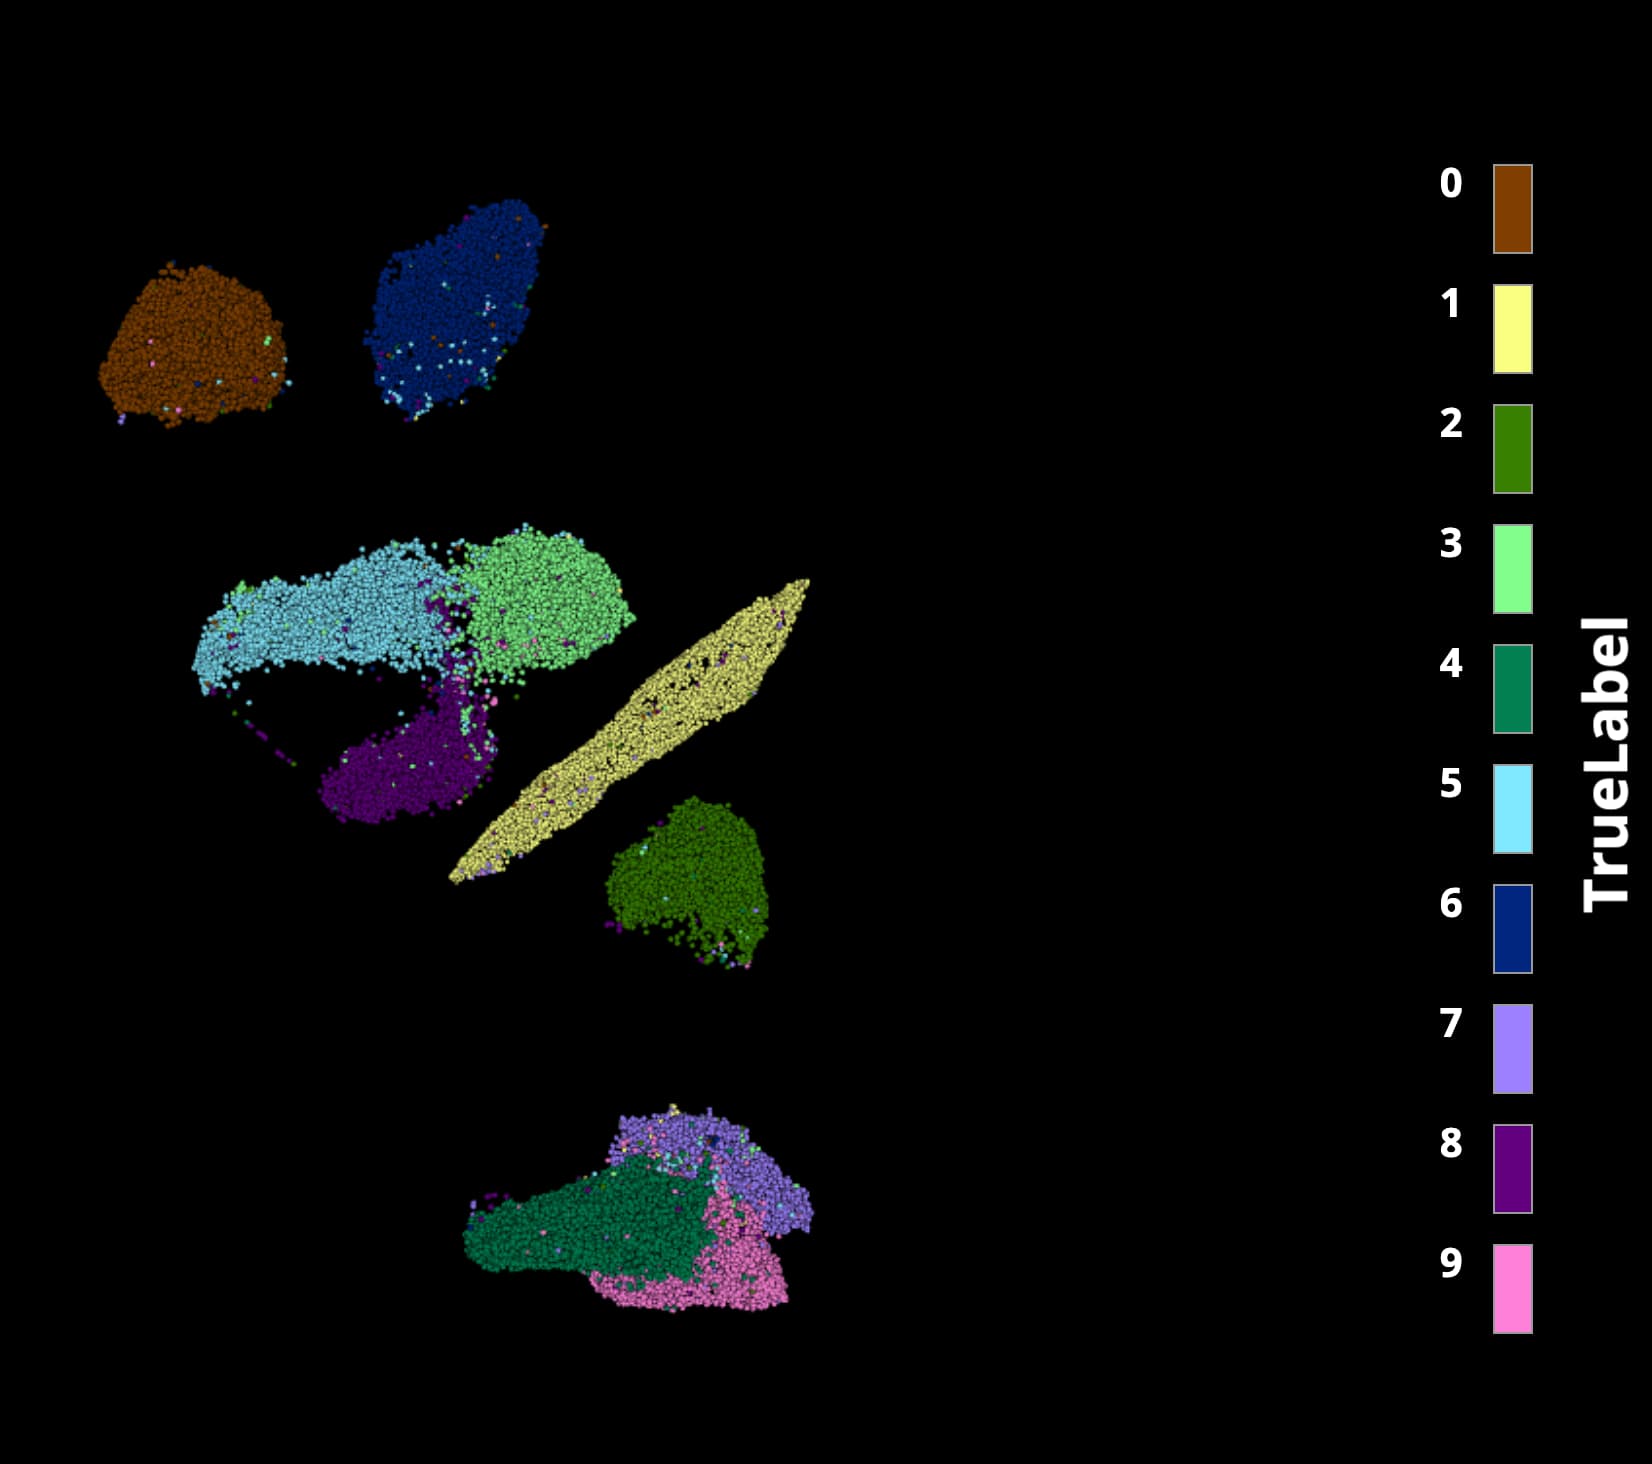
I have hacked something together here (by just automatically “blacking” out parts of the colour map for the legend based on the number of unique discrete values that are to be shown.
Is there any way to specify to the scalar bar to show more “ticks”, i.e. in this case all digits from 0-9? I cannot find anything in the documentation.
That’s nice, but often the discrete values are not necessarily ordinary. I mean, the categorical variable can have random values such as 1,7,8,33,51, etc. That is quite common in geosciences applications for the rock type code in a geologic model.