How would you expect the 2 trees to render? Currently, only the second one is shown because both have the same coordinates.
You can show that by using a mask, where we hide 2 cells at level 1 on each piece
mask = pack_binary_string("0 0011 00000000 000 0 1100 00000000 000")

[...]
vtkgrp.create_dataset(
    "Mask",
    data=mask,
    dtype='u1',
    shape=mask.shape,
    maxshape=(None,)
)
(1 value for each cell + byte padding)
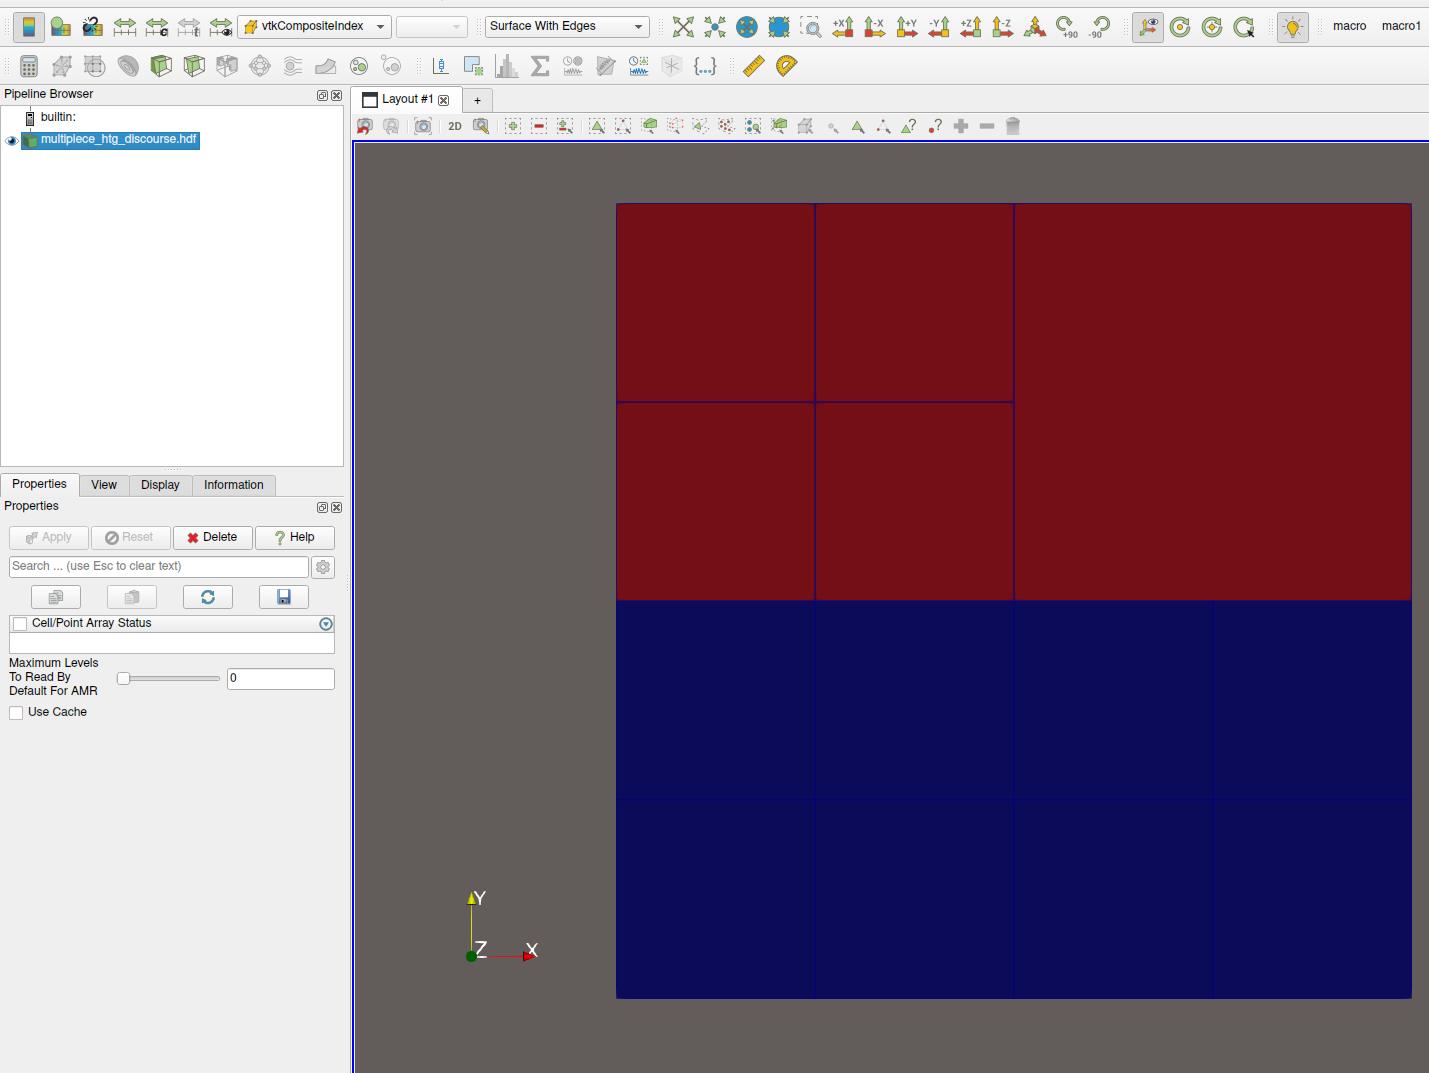
On ParaView with composite index as coloring: