Hi
I want to make a 3D shape which show color by value range like volume
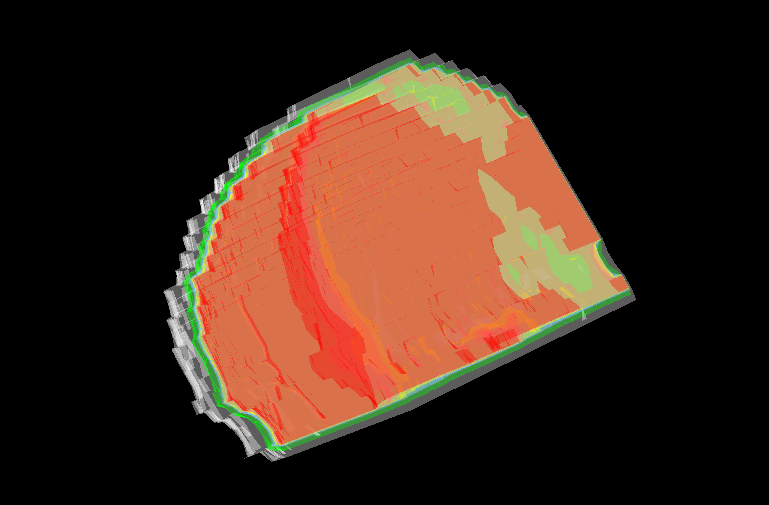
I have a RTDose dicom file and I want to make a 3D shape like this:
I tried that with volume . setting opacity and color of each range of value in volume property is so easy but the result was not good Because the colors are mixed together and I can’t see the layered color like the picture above.
so how can I make a 3D shape to show Dose value ?
( and how I see that in 3 Axes ( axial , sagittal , coronal) or how reslice that)
thanks for your help ![]() ;
;
