More pythonic interface / closer to numpy

Hi everyone,

I would like to propose some improvements to VTK both at C++ and Python level with the following goals:

  1. Convenient interface between the VTK data model and numpy, pandas etc. (wrapper changes -done-, python modules)
  2. More pythonic access to VTK objects through things like properties. (wrapper changes)
  3. A few convenience methods to make it easier to use VTK filters without hooking up a pipeline (what I call the imperative mode). (C++ changes mostly)
  4. A high level interface to rendering based on representations and views similar to that of ParaView (C++ changes)

I have a basic prototype that does some of 1-3 here. Note that I prototyped 2 and 3 in python even though much would be done at C++ / wrapper layer in the final implementation. I would love to hear feedback and ideas about all of these items and volunteers for the work would be great too :-). In this proposal, I would like to concentrate on item 1. I will create separate proposals for 2-4 in the future.

There is already a module that provides numpy friendly dataset classes:

from vtkmodules.numpy_interface import dataset_adapter as dsa
from vtkmodules.vtkImagingCore import vtkRTAnalyticSource

rt = vtkRTAnalyticSource()
rt.Update()
image = dsa.WrapDataObject(rt.GetOutput())
rtdata = image.PointData['RTData'] # rtdata is a numpy array compatible class

import vtkmodules.numpy_interface.algorithms as algs
rtmin = algs.min(rtdata) # wrappers around numpy algorithms
rtmax = algs.max(rtdata)
rtnorm = (rtdata - rtmin) / (rtmax - rtmin)
image.PointData.append(rtnorm, 'RTData - normalized')

This module also handles composite data and provides the same interface:

from vtkmodules.vtkCommonDataModel import vtkMultiBlockDataSet
mb = vtkMultiBlockDataSet()
mb.SetBlock(0, image.VTKObject)
mb.SetBlock(1, image.VTKObject)
cds = dsa.WrapDataObject(mb)
rtdatac = cds.PointData['RTData'] # VTKCompositeDataArray which manages multiple arrays under the covers
rtmin = algs.min(rtdatac)

This interface goes beyond simply providing numpy access. It supports:

  • Single datasets,
  • Composite datasets and arrays,
  • Algorithms that works over all of the data model and in distributed parallel.

These are used by ParaView’s python algorithms and filters.

IMO this is a fairly good interface and is pretty rich in functionality. However, it is not easy to discover, is not well integrated and could be more pythonic in the API.

In order to achieve these goals, David Gobbi and I made some changes to VTK wrapping. These enable one to override VTK wrapped classes with Python subclasses like this:

from vtkmodules.vtkCommonCore import vtkPoints
@vtkPoints.override
class vtkPointsCustom(vtkPoints):
    pass

p = vtkPoints() # p is actually a vtkPointsCustom instance

With this functionality in place (already merged to master, see this MR), we can take the existing functionality further:

from vtkmodules.vtkImagingCore import vtkRTAnalyticSource
import datamodel

rt = vtkRTAnalyticSource()
rt.Update()
image = rt.GetOutput() # image is actually datamode.Image which has numpy accessors
rtdata2 = image.point_data["RTData"] * 2
image.point_data["rtdata2"] = rtdata2

We can also do things like this:

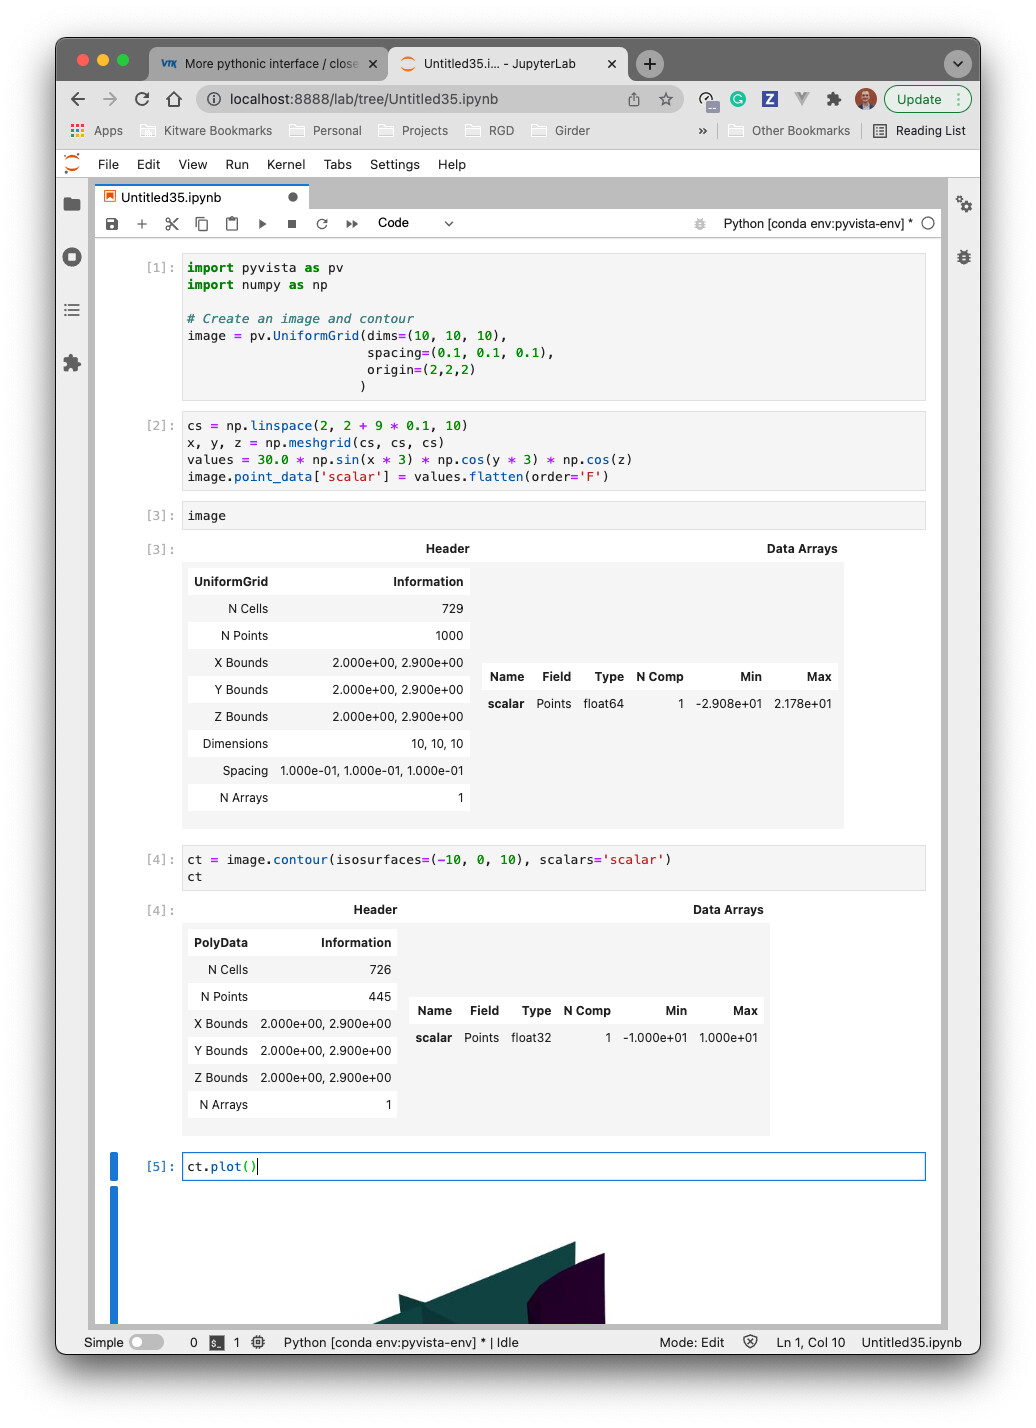
image = datamodel.ImageData(dimensions=(10, 10, 10), spacing=(0.1, 0.1, 0.1), origin=(2,2,2))
cs = numpy.linspace(2, 2 + 9 * 0.1, 10)
x, y, z = numpy.meshgrimage(cs, cs, cs)
values = 30.0*numpy.sin(x*3)*numpy.cos(y*3)*numpy.cos(z)
image.point_data['scalar'] = values.flatten(order='F')

Note that ideally, the constructor would be vtkImageData not ImageData. This needs changes to the wrappers, which we could do in the future.

The prototype that I provided supports vtkImageData, vtkPartitionedDataSet (including iterating over partitions) and arrays/attributes. Extending it to all of VTK’s data model is fairly easy since the dataset_adapter module handles most of the complications.

So what do you think?

6 Likes

This looks really cool. Maybe I missed it, but what does an example VTK python script using imperative mode look like?

Having example on how to define points and cells for various dataset type would be great.

All the field API seems great and I love it.

What a great idea.

We do actually use it in some of the vtk-examples e.g. CurvaturesAdjustEdges, VTKWithNumpy

The only reason that I know of the interface is through these articles starting with: Improved VTK – numpy integration, there are five posts in the series.

I would be glad to help. If anyone wants to rough out examples I can easily enter them into the vtk-examples.

I like the override mechanism.

Regarding numpyfication, let’s keep in ming that numpy is an optional dependency of VTK.

I’m not much of a python guy but I’m really thrilled by these 2 changes. However I hope that this representation layer will not bloat the rendering part of VTK too much. This is only my personal opinion but :

  • representation in ParaView are cool but lacks of clarity. For exemple the geometry representation takes care of way too many different representations and use cases.
  • I find diving into the rendering code of VTK very daunting every time. This might be out of scope of this proposition but the whole rendering layer could be redesigned and simplified so it is easier to use for both developers and users.
2 Likes

I know (3) was one of the goals of the pipeline re architecture ages ago. While no one packaged it up, the idea was that with the new APIs you could in vtkAlgorithm define a function that calls the needed requestFoo methods under the hood and present the user with an immediate functional API like

filter->GenerateData(inputDatas, outputDatas);

with the user not required to know about or create any pipelines. I think this is still possible today without a lot of code. So the more full example would be something like:

wave = vtkWavelet()
wave.GenerateData(waveData);
iso = vtkIsosurace();
iso.SetIsoValues(2,3,4);
iso.GenerateData(waveData, isoData);
writer = vtkOBJWriter();
writer.SetFileName("foo.obj");
writer.WriteData(isoData);

I am going to have another proposal for (3) but since we started discussing it here is what I prototyped:

    # Create an image and contour
    id = ImageData(spacing=(0.1, 0.1, 0.1), origin=(2,2,2))
    id.dimensions = (10, 10, 10)
    cs = numpy.linspace(2, 2 + 9 * 0.1, 10)
    x, y, z = numpy.meshgrid(cs, cs, cs)
    values = 30.0*numpy.sin(x*3)*numpy.cos(y*3)*numpy.cos(z)
    id.point_data['scalar'] = values.flatten(order='F')
    ct = Contour(contour_values=(-10, 0, 10), scalar_name='scalar').execute(id)

So essentially as simple as adding some kind of execute() method that takes input(s), request parameters (such as extent optionally) and returns output(s). Being able to define properties in the constructor makes it possible to have one liners where the filter is temporary. This is just a prototype where I wanted to explore the concept. I didn’t spend much time worrying about the API.

1 Like

Regarding numpyfication, let’s keep in ming that numpy is an optional dependency of VTK.

Yes totally. The new module would depend on numpy like the dataset_adapter module and would return an error if numpy is not available. Having said that I expect that we will add more and more functionality in python that depend on core python science modules like numpy, scipy and pandas. There is not a whole lot you can do in python without those unless you are willing to write python loops that are very slow.

1 Like

With regards to Pythonic API, we need to engage people in the Python community to see what interface is Pythonic to them. In my mind, the API would avoid carrying over artifacts from VTK’s execution model, e.g., the explicit execute() function in your example.

1 Like

Yeah I agree. That was something that I did to quickly show something. Do note that I am actually creating a filter in that example and calling execute() on it. I am strongly against a purely functional API as it would not jive with VTK’s spirit.

I am hoping that we have enough python folks here to get some feedback (at least once we start that topic separately :slight_smile: ). If not, I am open to suggestions on where to reach out.

Your 4 listed goals are exactly PyVista’s offerings. https://docs.pyvista.org/

2 Likes

Here is the proposed example, except in working PyVista code:

import pyvista as pv
import numpy as np

# Create an image and contour
image = pv.UniformGrid(dims=(10, 10, 10), 
                       spacing=(0.1, 0.1, 0.1), 
                       origin=(2,2,2)
                      )
# Add some data computed with NumPy
cs = np.linspace(2, 2 + 9 * 0.1, 10)
x, y, z = np.meshgrid(cs, cs, cs)
values = 30.0 * np.sin(x * 3) * np.cos(y * 3) * np.cos(z)
image.point_data['scalar'] = values.flatten(order='F')
# Apply a Contour filter
ct = image.contour(isosurfaces=(-10, 0, 10), scalars='scalar')
# Plot it, simply
ct.plot()

This handles data generation, filtering, and plotting.

Furthermore, it looks quite nice in Jupyter with rich outputs:

And interactive plotting (options for either server rendering or client rendering).
2022-02-27 23.31.52


For completeness, a numpy.meshgrid is better represented as a vtkStructuredGrid as in many cases, a meshgrid can be curvilinear. Here is that example with a structured grid:

import pyvista as pv
import numpy as np

# Add some data computed with NumPy
cs = np.linspace(2, 2 + 9 * 0.1, 10)
x, y, z = np.meshgrid(cs, cs, cs)
values = 30.0 * np.sin(x * 3) * np.cos(y * 3) * np.cos(z)

# Use vtkStructuredGrid instead
mesh = pv.StructuredGrid(x,y,z)
mesh.point_data['scalar'] = values.flatten(order='F')
# Apply a Contour filter
ct = mesh.contour(isosurfaces=(-10, 0, 10), scalars='scalar')
# Plot it, simply
ct.plot()
3 Likes