Hi,
Is it possible to plot the y values of each point in chartxy?
Thank you
Hi,
Is it possible to plot the y values of each point in chartxy?
Thank you
Hello,
Yes.
best,
PC
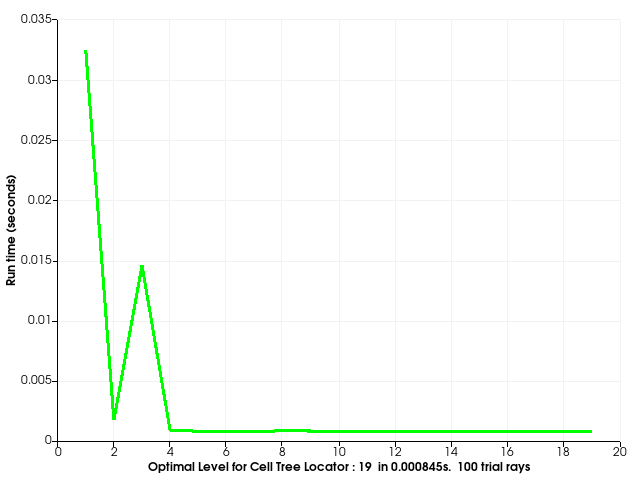
I tryed this but it dind’t work:
    // Add multiple line plots, setting the colors etc.
    vtkNew<vtkChartXY> chart;
    view->GetScene()->AddItem(chart);
    vtkPlot* line = chart->AddPlot(vtkChart::LINE);
    line->SetInputData(table, 0, 1);
    auto lineColor = colors->HTMLColorToRGBA("Lime").GetData();
    line->SetColor(lineColor[0], lineColor[1], lineColor[2], lineColor[3]);
    line->SetWidth(3.0);

    std::vector<vtkSmartPointer<vtkActor>> actors;
std::vector<vtkSmartPointer<vtkTextMapper>> textMappers;
std::vector<vtkSmartPointer<vtkActor2D>> textActors;
  vtkNew<vtkTextProperty> textProperty;
  textProperty->SetFontSize(16);
  textProperty->SetJustificationToCentered();


    // Iterate over the table and add text annotations for each point
for (vtkIdType i = 0; i < table->GetNumberOfRows(); ++i) {
    // Get x and y values of the point
    double xValue = table->GetValue(i, 0).ToDouble();
    double yValue = table->GetValue(i, 1).ToDouble();

    // Create a text annotation for the point's value
    // Create a text annotation for the point's value
    textMappers.push_back(vtkSmartPointer<vtkTextMapper>::New());
    textMappers[i]->SetInput(std::to_string(yValue).c_str());
    textMappers[i]->SetTextProperty(textProperty);

    textActors.push_back(vtkSmartPointer<vtkActor2D>::New());
    textActors[i]->SetMapper(textMappers[i]);
	     textActors[i]->SetPosition(xValue, yValue);

     view->GetRenderer()->AddActor(textActors[i]);}
What happens?
It plots without the points
Then you need to add a second plot to the chart with points instead of connected lines:
   vtkPlot* points = chart->AddPlot(vtkChart::POINTS);
   points->SetInputData(table, 0, 1);
   dynamic_cast<vtkPlotPoints*>(points)->SetMarkerStyle(vtkPlotPoints::DIAMOND);
   points->SetColor(lineColor[0], lineColor[1], lineColor[2], lineColor[3]);
This sets the same XY data you assigned to the lines plot so you have diamond-shaped bullets along green line with the same color.
Here, this is a more complete example of how to plot XY values as points: https://examples.vtk.org/site/Cxx/Plotting/ChartMatrix/
I want something like this:
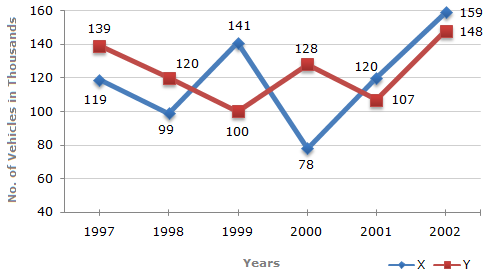
I’ve told exactly what you need to do to achieve that.