We have been in the process of upgrading our application from
Qt5.14 → Qt6.x
VTK 8.2 → 9.2.x
PCL 1.11.1 → 1.13.x
On windows 10 with Visual C++ 2019 in C++17 mode.
We use QVTKOpenGLNativeWidget, vtkGenericOpenGLRenderWindow and PCL’s PCLVisualizer to display point clouds in real time. The setup of these classes is just like in PCL tutorials:
    auto renderer = vtkSmartPointer<vtkRenderer>::New();
    renderWindow_ = vtkSmartPointer<vtkGenericOpenGLRenderWindow>::New();
    renderWindow_->AddRenderer(renderer);
    visualizer = new pcl::visualization::PCLVisualizer(renderer, renderWindow_, "viewer", false);
    this->setRenderWindow(visualizer->getRenderWindow());
    visualizer->setupInteractor(this->interactor(), this->renderWindow());
Unfortunately, it seems like the rendering is much slower in the new version.
The # of points that we need to render is perhaps 80k-100k. The old GUI is responsive when we move the camera around, the new is much less responsive, sometimes the whole GUI is unresponsive. If I just measure the time of QVTKOpenGLNativeWidget::render(), the old version would rarely take more than 5ms, now its 15-20 times more likely. It also seems like the GPU is seeing higher loads. In task manager the GPU usage has gone up from about 20% to 40%.
I’m aware there are several issues that have already been discussed and potentially resolved, also recently. So I tried newest PCL 1.13.1 and the master branch from VTK last week. It did not appear to solve our issue.
We are running out of ideas of what could be the cause of this slowdown. Any help/ideas would be greatly appreciated.
Unless there’s some insight by someone who happens to know more, for tracking this down, I think a kind of bisection would be best (yes, it’s a lot of work; some thinking and direct debugging is probably better done first). I think the first thing is whether Qt5 and the VTK/PCL update has this (to rule out Qt as the culprit). If that’s still slow, I’d go to the oldest VTK supported by the newest PCL (probably 8.90/9.0-ish for buildsystem reasons). If that is slow, push PCL back to the oldest that supports the new VTK build system. If that is slow, it’s something before and both PCL and VTK can be pushed back to the old build systems and bisecting within there. Otherwise, bisect within the new buildsystem.
In addition to Ben’s suggestion, if there is any way you can profile your application to find out which calls are taking up a significant amount of time within QVTKOpenGLNativeWidget::render. AFAIK, there shouldn’t be a performance overhead of that magnitude by just switching from Qt 5 to 6.
Thanks for the swift reply. I have one other data point that probably rule out Qt as the problem. The following dependency settings also exhibit the problem:
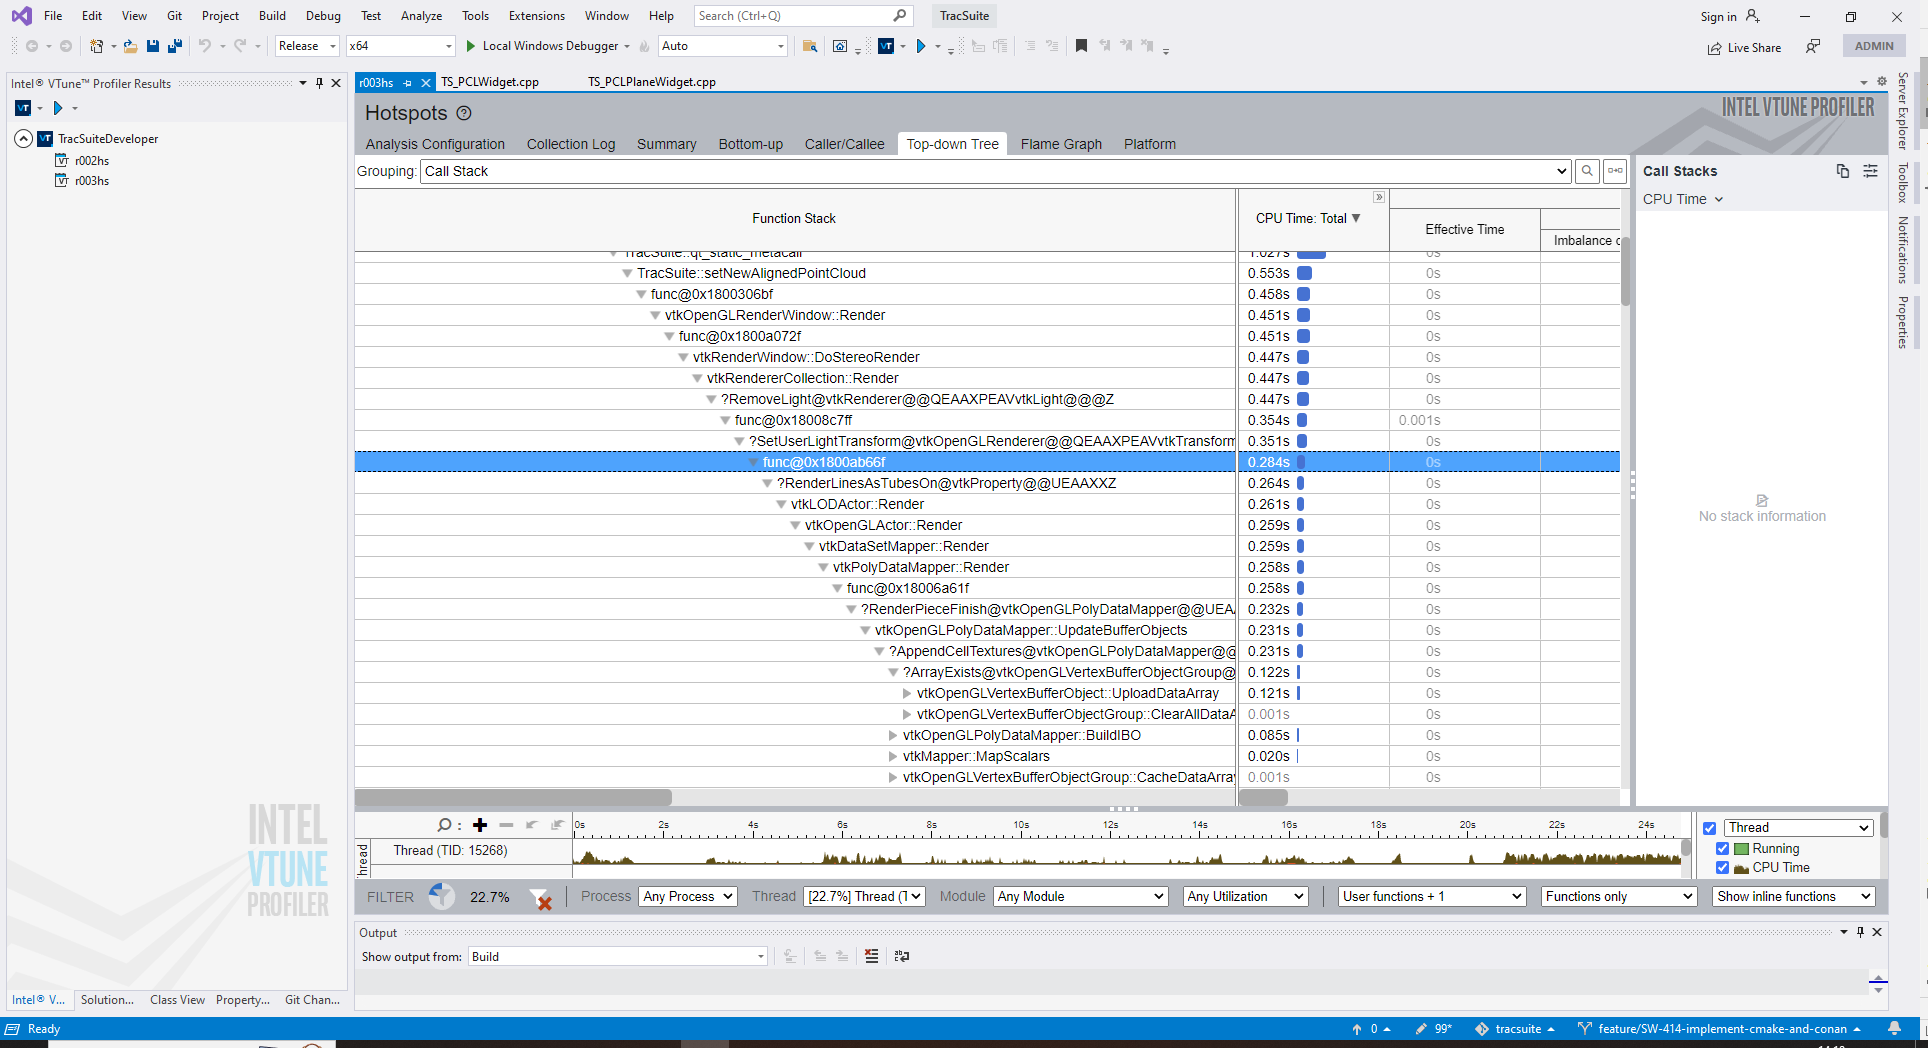
So, are you calling RemoveLight each frame? That trace indicates that it is uploading buffer objects which is expected to take some time. However, the upload shouldn’t be done for each frame. If it is doing that (and you’re not changing data, property, etc.), it might be a bug in the mapper.
Given that new data is being rendered every 30ms, regenerating and uploading buffers should be done. However, I don’t see why/how RemoveLight gets invoked each time. Is it creating a new render window/renderer each time new data is being visualized?
As for why the poor performance with the new version, it would really help if you can reproduce it with a small example and/or bisect the history to narrow down the problematic change.
We have been digging more into this. We still don’t know why exactly we see a difference between the old and the new version.
However, we have restored the app’s GUI to an acceptable state where the rendering is fairly smooth and responsive. We have simply cut down on the number of render() calls; we called render 3 times for one processing frame (add a point cloud, render(), and a new point cloud render()…), and we determined that it was really not necessary, 1 call at the end would suffice.
@Thorsten_Ottosen Batching up render calls when making sweeping changes to the scene is sure to make it perform faster. I am curious though as to why that didn’t affect performance in the older version. Let me know if you find anything else weird with your use case.