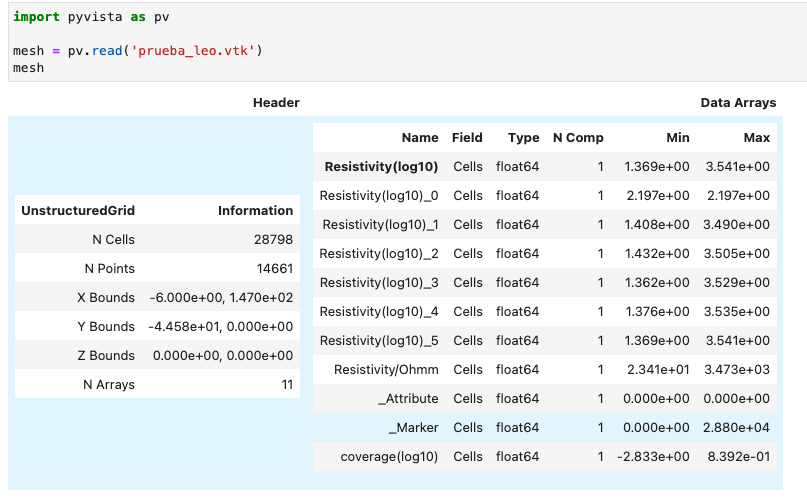
Hi, I am new in VTK, and I have a vtk UnstructuredGridFile and I read it, but it show me with polygons and I need to deploy it as isosurface. This is my code
I can’t upload an image (I am a new user here). I need help pls
from vtk import (vtkUnstructuredGridReader, vtkDataSetMapper, vtkActor,
                 vtkRenderer, vtkRenderWindow, vtkRenderWindowInteractor, vtkContourFilter)

from vtk import *

file_name = 'prueba_leo.vtk'
reader = vtkUnstructuredGridReader()
reader.SetFileName(file_name)
reader.Update()
output = reader.GetOutput()
output_port = reader.GetOutputPort()
scalar_range = output.GetScalarRange()


#add filter NUEVO

c2p = vtkCellDataToPointData()
c2p.SetInputData(output)

contours = vtkContourGrid()
contours.SetInputData(c2p.GetOutput())
contours.SetValue(0, 9)

#create the mappers
#import pdb; pdb.set_trace()
#mapper = vtkDataSetMapper()
#mapper.SetInputConnection(output_port)
#mapper.SetScalarRange(scalar_range)
gridmapper = vtkDataSetMapper()
gridmapper.SetInputData(output)
#gridmapper.GetInput().GetCellData().SetActiveScalars("A")
gridmapper.SetScalarVisibility(1)
gridmapper.SetScalarRange(scalar_range)

#creamos el otro mapper
mapper = vtkPolyDataMapper()
mapper.SetInputConnection(contours.GetOutputPort())

#create The Actor
actor = vtkActor()
actor.SetMapper(mapper)

gridactor = vtkActor()
gridactor.SetMapper(gridmapper)
gridactor.GetProperty().EdgeVisibilityOn()

# Create the Renderer
renderer = vtkRenderer()
renderer.AddActor(actor)
renderer.AddActor(gridactor)
renderer.SetBackground(1, 1, 1) # Set background to white


# Create the RendererWindow
renderer_window = vtkRenderWindow()
renderer_window.AddRenderer(renderer)

# Create the RendererWindowInteractor and display the vtk_file
interactor = vtkRenderWindowInteractor()
interactor.SetRenderWindow(renderer_window)
interactor.Initialize()
interactor.Start()
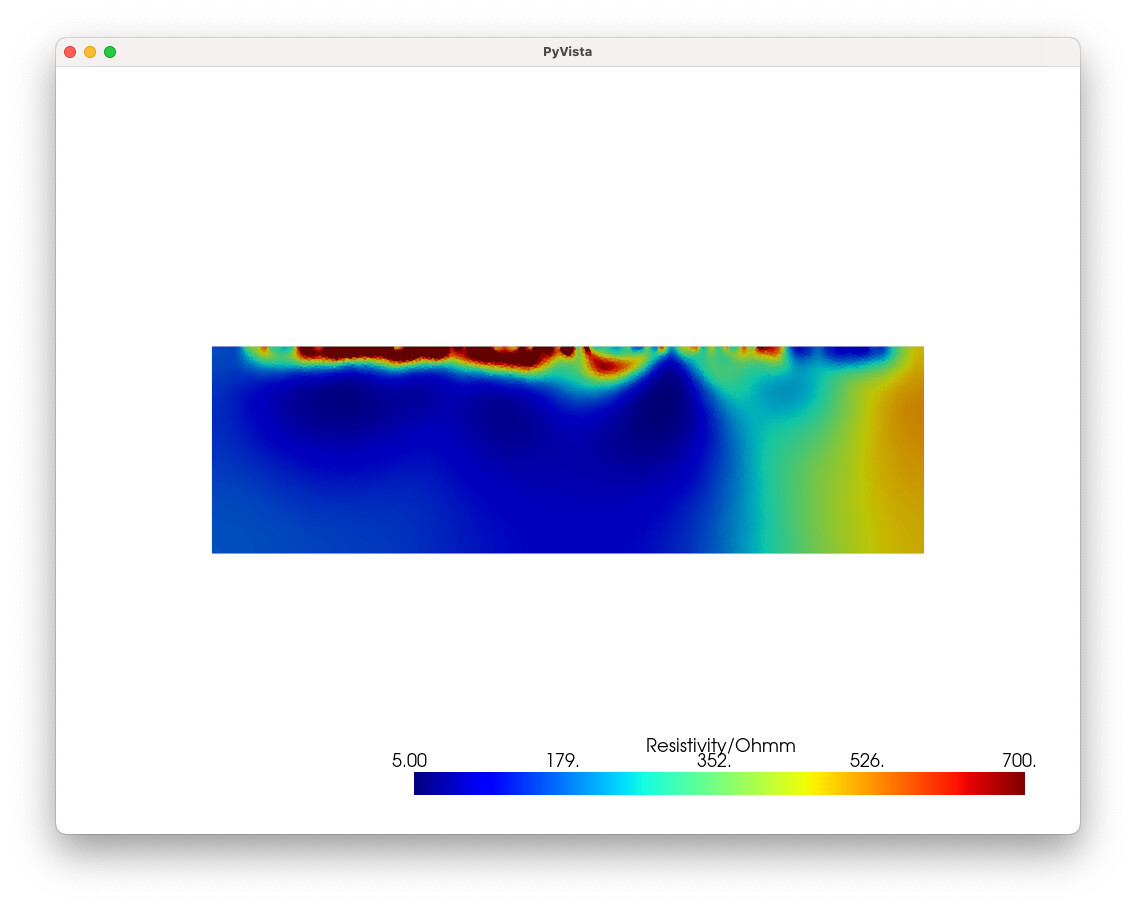
Since your data are a 2D surface, taking contours will generate isolines rather than isosrufaces.
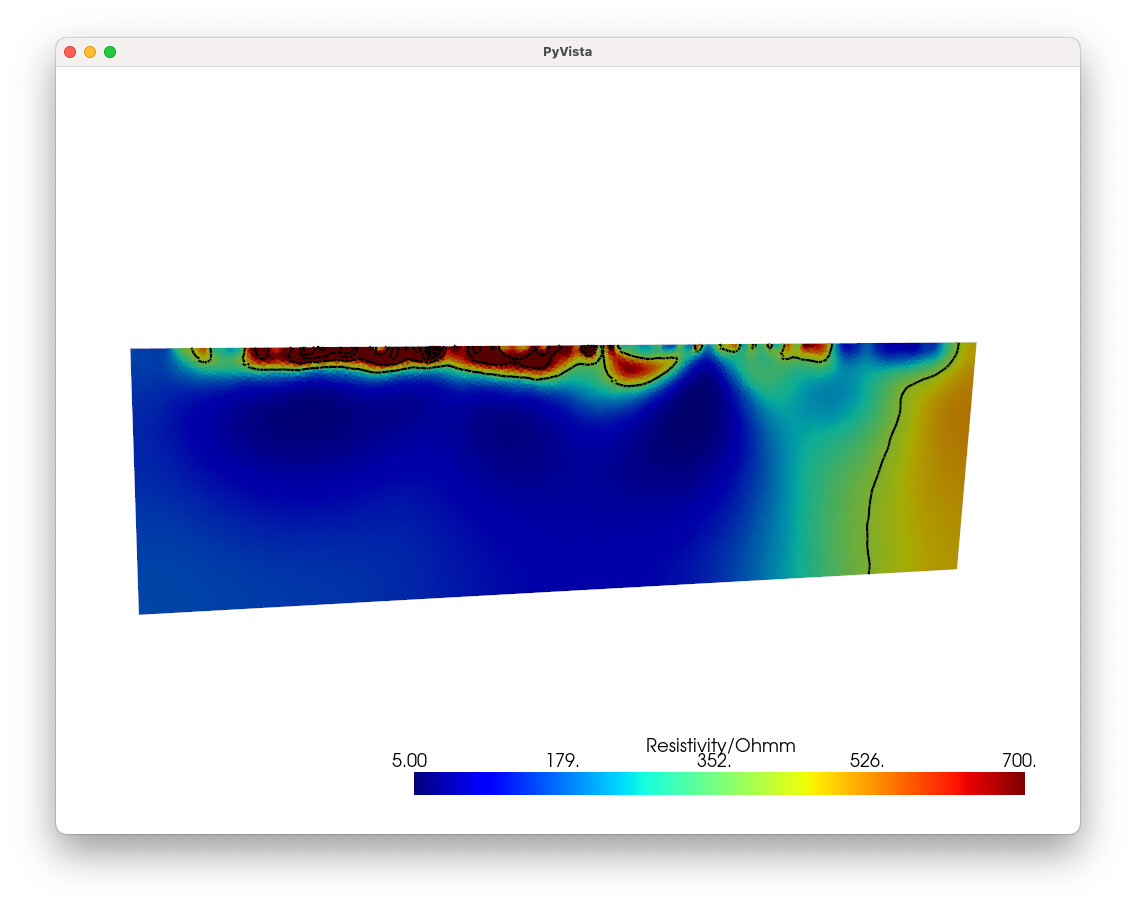
Generate isolines with a contour filter:
# Must migrate cell data to point data for contouring to work
iso = mesh.cell_data_to_point_data().contour(10, scalars='Resistivity/Ohmm') # <- creates 10 isosurfaces

plotter = pv.Plotter(notebook=0)
plotter.add_mesh(iso, color='black', line_width=5)
plotter.add_mesh(mesh, scalars='Resistivity/Ohmm', cmap='jet', clim=[5,700],)
plotter.view_xy()
plotter.show()
God Bless you, thanks! I’m gonna study Pyvista, but I’m new in this kind of job (it’s my first and Im so excited) and I want to learn how to do this in vtk, can you help me if you want of course… Thanks, you saved my position!
Power to you for wanting to learn VTK proper! I, unfortunately, do not have the bandwidth to walk through a full example in pure VTK to do this. But the VTK examples is a great place to get started: https://kitware.github.io/vtk-examples/site/
so you need to either pick a value in this range or automatically generate few in the range. For the latter you can do:
contours.GenerateValues(10,vrange[0],vrange[1])
Now the fitler should work as you expect. To make things more visible I would also suggest to place the contour line actor after the grid.
Here is an edited version of your script:
from vtk import (vtkUnstructuredGridReader, vtkDataSetMapper, vtkActor,
                 vtkRenderer, vtkRenderWindow, vtkRenderWindowInteractor, vtkContourFilter)

from vtk import *

file_name = 'prueba_leo.vtk'
reader = vtkUnstructuredGridReader()
reader.SetFileName(file_name)
reader.Update()
output = reader.GetOutput()
output_port = reader.GetOutputPort()
scalar_range = output.GetScalarRange()


#add filter NUEVO

c2p = vtkCellDataToPointData()
c2p.SetInputData(output)
## Generate output !
c2p.Update()

contours = vtkContourGrid()
contours.SetInputData(c2p.GetOutput())
## Pick values in range:
#contours.SetValue(0, 2)
# or
array = c2p.GetOutput().GetPointData().GetArray(0)
vrange = array.GetValueRange()
contours.GenerateValues(10,vrange[0],vrange[1])
contours.Update()

#create the mappers
#import pdb; pdb.set_trace()
#mapper = vtkDataSetMapper()
#mapper.SetInputConnection(output_port)
#mapper.SetScalarRange(scalar_range)
gridmapper = vtkDataSetMapper()
gridmapper.SetInputData(output)
#gridmapper.GetInput().GetCellData().SetActiveScalars("A")
gridmapper.SetScalarVisibility(1)
gridmapper.SetScalarRange(scalar_range)

#creamos el otro mapper
mapper = vtkPolyDataMapper()
mapper.SetInputConnection(contours.GetOutputPort())

#create The Actor
actor = vtkActor()
actor.SetMapper(mapper)

gridactor = vtkActor()
gridactor.SetMapper(gridmapper)
gridactor.GetProperty().EdgeVisibilityOn()

# Create the Renderer
renderer = vtkRenderer()
# draw first the grid and then the lines.
renderer.AddActor(gridactor)
renderer.AddActor(actor)
renderer.SetBackground(1, 1, 1) # Set background to white


# Create the RendererWindow
renderer_window = vtkRenderWindow()
renderer_window.AddRenderer(renderer)

# Create the RendererWindowInteractor and display the vtk_file
interactor = vtkRenderWindowInteractor()
interactor.SetRenderWindow(renderer_window)
interactor.Initialize()
interactor.Start()