Sort points on line in PolyData

So I have a PolyData object of lines generated from extracting feature edges from a 2D unstructured grid and then cutting out portions of the feature edges I didn’t want.

In my example, the original grid was just a square, so the feature edges would equally just be a square. Then I “extracted” out one side of the square. I would like to have the points of this PolyData object be in the order of the line, as currently they are more-or-less random.

From this definition on the VTK examples website, maybe the solution would be to convert the PolyData to a PolyLine? I can’t find any obvious path to achieve this though.

You can use vtkStripper to merge randomly ordered line segments into polylines. If the polydata is large then you may need to increase MaximumLength.

So this does work, but it has the unintended effect of combining the individual cells into single lines. ie.

wallpoly.GetNumberOfCells() # 1246

strip = vtk.vtkStripper()
strip.SetInputData(wallpoly.GetOutput())
strip.Update()
wallstrip = strip.GetOutput()

wallstrip.GetNumberOfCells() # 2

I tried setting strip.SetJoinContiguousSegments(False), but this did not change anything. It’s not a deal breaker by any means, but it would be nice to preserve the cells/lines.

Hi,

Indeed I haven’t been able to notice a difference when strip.SetJoinContiguousSegments() is set to True.

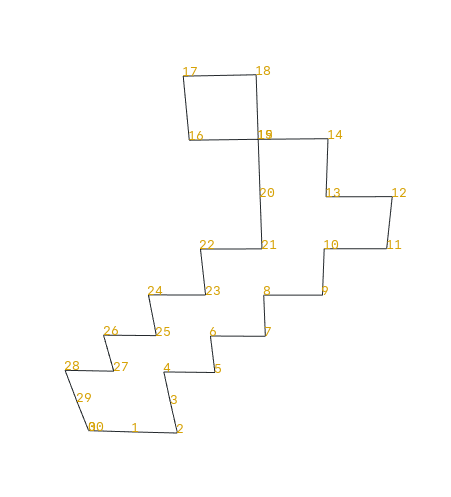
How to sort anti-clockwise points from a polydata ?

You will see that points 16, 17, 18 are not ordered correctly if you expect an anti-clockwise sort.

from vedo import *

! wget -q -nc https://thredds-su.ipsl.fr/thredds/fileServer/ipsl_thredds/brocksce/tmp/poly_02.vtk

g = load('poly_02.vtk')

line = Line(g.points())
labels = line.labels2d(c="yellow4", scale=0.7)
show(line, labels, axes=0, interactive=True, zoom=1, roll=90, azimuth=-90, elevation=0)

image

If the polygon is self-intersecing then you can split it to non-intersecting polygons, determine the winding direction for each polygon, and then merge the polygons.

1 Like

Hi Andreas,
This is indeed a strategy.
But I haven’t found how to split it.
See create separated regions from polydata - #25 by Paulo_Carvalho

Your snippet of codes are welcomed.

…you need to parse the line connectivity and split where needed as Andras suggests, it’s a numpy exercise… e.g.

from vedo import *

g = load('data/poly_02.vtk')
lines = Line(g.points()).clean().join_segments()
line = lines[0]
pts = line.points()
crosses = []
for i in range(1, line.npoints):
    if len(line.connected_cells(i, return_ids=True)) > 1:    
        crosses.append(i)
print("crosses", crosses)

# split numpy array into subarrays at specific indices
arr = np.array(line.lines()[0])
splits = np.where(arr == crosses[0])[0]
print("splits", splits)

# form 2 lines from the split array
twolines = [
    np.split(arr, splits)[0].tolist() + np.split(arr, splits)[2].tolist(),
    np.split(arr, splits)[1].tolist(),
]
print('twolines', twolines)

line1, line2 = Line(pts[twolines[0]]), Line(pts[twolines[1]])
labels1 = line1.labels2d(c="green4")
labels2 = line2.labels2d(c="red4")
show(line1, labels1, line2, labels2).close()
show(line1.triangulate().bc('red4'), line2.triangulate().bc('red4'))

Screenshot from 2023-04-06 16-14-56

Screenshot from 2023-04-06 16-17-57

1 Like

Ok nice. Thanks
I am testing the code.
And describe coordinates anti-clockwise, is the a way to do this ?

yes, you can compute the winding direction of each loop and reverse the point IDs order based on its sign, e.g.

    data = np.asarray(points)
    datamean = data.mean(axis=0)
    pts = data - datamean
    res = np.linalg.svd(pts)
    dd, vv = res[1], res[2]
    n = np.cross(vv[0], vv[1])
    v = np.zeros_like(pts)
    for i in range(len(pts) - 1):
        vi = np.cross(pts[i], pts[i + 1])
        v[i] = vi / np.linalg.norm(vi)
    ns = np.mean(v, axis=0)  # normal to the points plane
    if np.dot(n, ns) < 0:
        n = -n

the less trivial part is the triangulation i guess… (you may consider some non linear 2d map projection…)

Ok. Less trivial as you wrote.
No vtk higher level function to do that ?

the orientation? i’m not sure… maybe a combination of vtkReverseSense and vtkPolyDataNormals with ConsistencyOn()

This kind of specific settings (here made for only 1 cross) do not resist when you want to generalize the algorithm.

image

Hello,

Maybe you can try the Shapely library: python - Splitting self-intersecting polygon only returned one polygon in Shapely - Stack Overflow

best,

PC

Hello,

@marcomusy’s answer uses NumPy for performance critical operations (e.g. singular value decomposition), if that is your concern. And certainly the for loop can be avoided by vectorized calls to the cross product and the vector norm. NumPy is supposed to be a decent alternative to its Matlab equivalents. Vectorizing NumPy functions normally takes the standard of telling it how to iterate over the vectors according to how they are arranged in a matrix (e.g. np.linalg.norm(x, axis=1) if you have the point data as row-vectors). See this: python - How to apply numpy.linalg.norm to each row of a matrix? - Stack Overflow . The cross product function likely follows the same rationale.

regards,

PC

Yes indeed. Have tried but shapely does not work in 3D.
I wanted to have separate polylines from the vtk process.

So my concern is why there is 2 cells detected for the region 7.
I do not understand why.

import pyvista as pv
import vtk
import random

! wget -q -nc https://thredds-su.ipsl.fr/thredds/fileServer/ipsl_thredds/brocksce/pyvista/mesh3D.vtk
mesh = pv.PolyData('mesh3D.vtk')

edges = mesh.extract_feature_edges(boundary_edges=True)

pl = pv.Plotter()

pl.add_mesh(pv.Sphere(radius=6300E3, theta_resolution=360, phi_resolution=180))
pl.add_mesh(mesh, show_edges=True, edge_color="gray")

regions = edges.connectivity()
regCount = len(set(regions.get_array("RegionId")))

connectivityFilter = vtk.vtkPolyDataConnectivityFilter()
stripper = vtk.vtkStripper()

#r_choice = 7
for r in range(regCount):
#for r in [r_choice]:
    connectivityFilter.SetInputData(edges)
    connectivityFilter.SetExtractionModeToSpecifiedRegions()
    connectivityFilter.InitializeSpecifiedRegionList()
    connectivityFilter.AddSpecifiedRegion(r)
    connectivityFilter.Update()
  
    stripper.SetInputData(connectivityFilter.GetOutput())
    stripper.SetJoinContiguousSegments(True)
    stripper.Update() 
    
    cleaner = vtk.vtkCleanPolyData()
    cleaner.SetInputData(stripper.GetOutput())
    cleaner.Update()
    
    reg = cleaner.GetOutput()
    print(r, reg.GetNumberOfCells(), reg.GetNumberOfPoints())
    
    if r == r_choice:    
        p = pv.PolyData(reg)
        p.save('poly_%02d.vtk' %(r_choice))
    
    random_color = "#"+''.join([random.choice('0123456789ABCDEF') for i in range(6)])
    pl.add_mesh(reg, color=random_color, line_width=4)

viewer = pl.show(jupyter_backend='trame', return_viewer=True)
display(viewer)
0 1 294
1 1 556
2 1 29
3 1 8
4 1 80
5 1 838
6 1 24
7 2 56     <----- 2 cells !
8 1 38
9 1 42
10 1 22
11 1 19
12 1 22
13 1 44
14 1 44
15 1 26
16 1 90
17 1 12
18 1 11
19 1 14
20 1 19
21 1 11

Your problem is not truly 3-D. Your data are locations on the Earth, so working with their XYZ positions is an unnecessary complication. I strongly recommend working with lat-long polar values or use some projection suitable for world maps (e.g. Mercator) if you want to work with Cartesian coordinates.

Not agree because finding convex polylines is easier with 3D cartesian coordinates.

Find for example the polyline that describes Antartica continent.
image

You can convert XYZ absolute postions to polar coordinates with this example: python - Faster numpy cartesian to spherical coordinate conversion? - Stack Overflow . The first solution is a vectorized (loop-free) example. Just throw away the radius (will be constant for points in the surface of a sphere) and you’ll reduce your problem to 2D.

From my experience I can tell you: that’s the wrong way to process geographic data. But if you want to stick to 3D data, be warned.

Always hard to have links to other approaches when I have tried to describe the problem with a concrete code ready to be tested.

See the problem described here bellow that comes from polygons that are folded.

My strategy was to find each individual convex polylines from vtk, then indeed use shapely to set the order. Then produces maps with cartopy.