They are not “other approaches”. They are steps to solve problems. I think you want a magic bullet to solve a complex problem in a single shot, but in reality this is rarely the case. Complex data processing must be broken down into small manageable problems. That’s what me and others have been trying to do. Then it’s your mission to put them together to engineer a workflow to suit your need. You should not expect others to do all the job for you (at least for free). No wonder that SO question got downvoted (that was not me, I swear).
I have really try to make my question accessible by separating it into smaller problems.
Giving also the big picture beside.
So my questions to VTK Discourse were clear enough to be analysed by more experimented developpers in my humble opinion.
Why I am not able to produce separate cells from the vtkStripper ? Why the region 7 produces 2 cells ?
Sorry No, I do not expect other do my work. That is really not correct to answer this.
I thank @marcomusy that indeed helps me to discover vedo library and really answered from the code I had prepared. Other answers were very far from what I was expecting indeed.
Why vtkStripper.SetJoinContiguousSegments() seems to have no differences when set to True or False ?
This is the kind of answers I would like to have…
Sorry, I mean no offense. But you reached SO with a “here’s my code, it has a bug, please, find it for me”. That’s not a question, that’s a challenge. The community frowns upon stuff like that, unless you use SO’s bounty-hunting mechanism. Place a bounty and maybe someone will accept the challenge… Just an advice.
Now back to the problem in hand:
Where’s the figure showing the region 7?
Really not easy to be understood. With a lot of caricatural behaviour you intend to put on me.
Again, I do not expect that someone solves my all problem but perhaps yes to have a look into some points I would have missed in the snippets of code each time prepared to illustrate the problem.
The snippet that produces 2 cells for region 7 is above.
The reply where I have put the output.
0 1 294
1 1 556
2 1 29
3 1 8
4 1 80
5 1 838
6 1 24
7 2 56     <----- 2 cells !
8 1 38
...
I hope these figures helps illustrating the importance of reducing your problem to 2D.
This is a simple example of a seemingly self intersecting polygon whose vertexes belongs to a sphere:
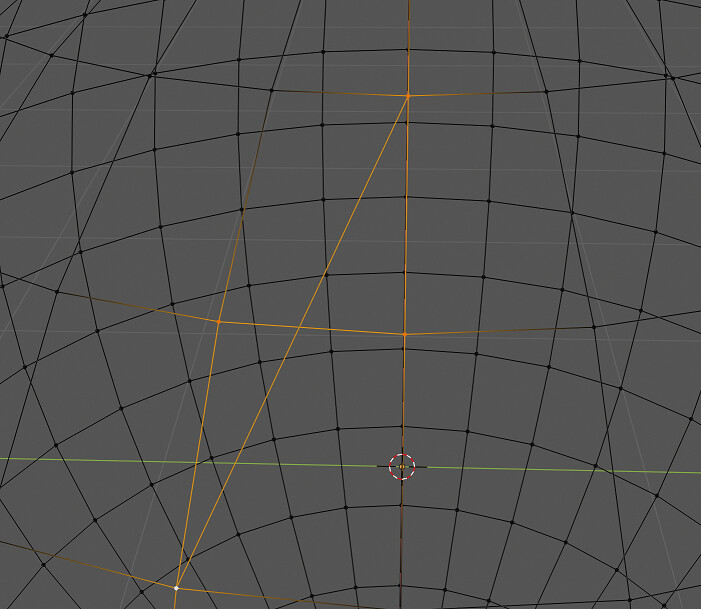
However, the fact that the vertexes are on the surface doesn’t mean the edges are:
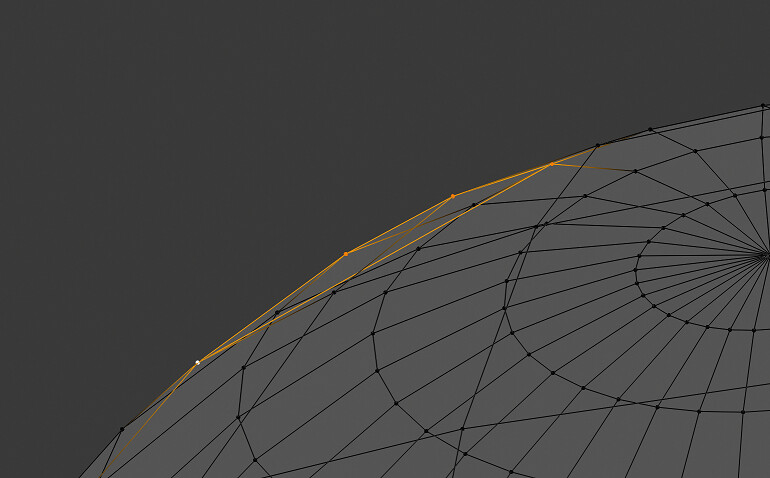
As you can see, the edges may not cross in 3D. That likely explains the polygon-splitting algorithm fails here and there. Why don’t you work in 2D space (e.g. lat-long or projected XY) and try the algorithms again?
Surely Antarctica results in an open poly when projected in Mercator projection, for example. Use your creativity. It’s not difficult to write a routine that closes the Antarctica poly:
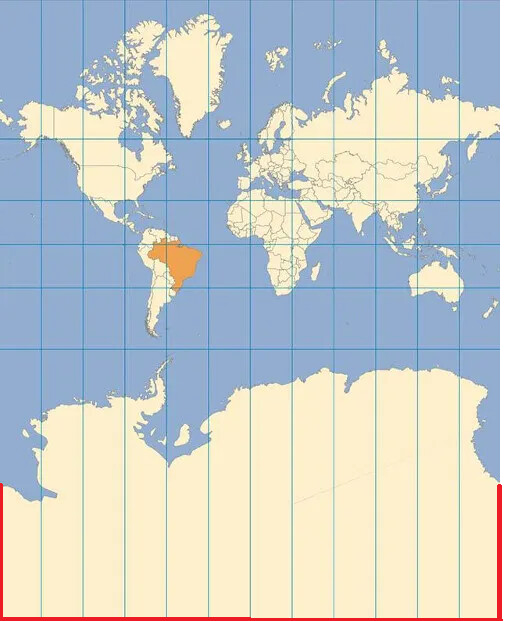
The red line shows how to add two more vertexes and close it.
Furthermore, you can use another projection. The azimuthal equidistant projection, for example, will result in all-closed polygons, even Antarctica.
Thank you again for the your investigation but really do no understand your suggestions.
Some replies however.
-
“Use your creativity.” is really not correct to write. Is it a discourse where to learn how to be ?
-
“It’s not difficult to write a routine that closes the Antarctica poly”, I don’t think you get the point between doing a process one time and write a general algorithm. I have configuration with paleo-continents where they are placed differently. I don’t want to do custom settings and solve specific problems for a particular polygon !
The ccrs.geodetic() projection handles correclty cross-date problems by the way. So do not need to add extra polygons to fill it. Please have a look to python - How to detect inner polygons from a multipolygon shapely object? - Stack Overflow where you will see polygons correctly filled without adding any extra points ! Just a matter of describing the polygon in the right order and with continuous lines.
And again, I would prefer to understand the vtk.vtkStripper() problem I have submitted rather than other things.
But thanks again.
Have a look to this code if you want. That was the start of my investigation.
And my choice to separate each polygons since they seems not ordered correctly when folded.
And I still think that this step can be achieve from the VTK processing with 3D cartesian coordinates.
import matplotlib.pyplot as plt
from matplotlib.path import Path
from matplotlib.patches import PathPatch
import shapely
from shapely import geometry
import cartopy.crs as ccrs
import random
import pickle

#-----------------------------------------
! wget -nc https://thredds-su.ipsl.fr/thredds/fileServer/ipsl_thredds/brocksce/tmp/polys.pickle

with open('./polys.pickle', "rb") as poly_file:
    polygons = pickle.load(poly_file)

#-----------------------------------------
def polygon2patch(poly, **kwargs):
    path = Path.make_compound_path(
           Path(poly.exterior.coords, closed=True),
           *[Path(ring.coords) for ring in poly.interiors])
    patch = PathPatch(path, **kwargs)
    return patch

#-----------------------------------------
fig = plt.figure(figsize=(10,5))

#map_proj = ccrs.PlateCarree(-10)
#map_proj = ccrs.Orthographic(-10, 80)    # fill not correct
map_proj = ccrs.Orthographic(-10, 60)
ax = fig.add_subplot(1, 1, 1, projection=map_proj)

transform = ccrs.Geodetic()

holesNumber = []
for n,polygonA in enumerate(polygons.geoms):
    # 2, 11
    #if n in [2,11]:         continue
    if n != 5: continue
    holes = []
    for m,polygonB in enumerate(polygons.geoms):
        if (m == n): continue
        if polygonA.contains(polygonB):
            holes.append(polygonB.exterior.coords)
            holesNumber.append(m)
    if n in holesNumber: continue  # n is a hole
    polygonNew = geometry.Polygon(polygonA.exterior.coords, holes=holes)
    polygonNew = shapely.geometry.polygon.orient(polygonNew)   # Orient to be oriented counter-clockwise
    random_color = "#"+''.join([random.choice('0123456789ABCDEF') for i in range(6)])
    patch = polygon2patch(polygonNew, transform=transform, facecolor=random_color, lw=0.5, edgecolor="black")
    ax.add_patch(patch)
    print(n, len(polygonNew.exterior.coords))

ax.set_global()
ax.gridlines()
plt.show()
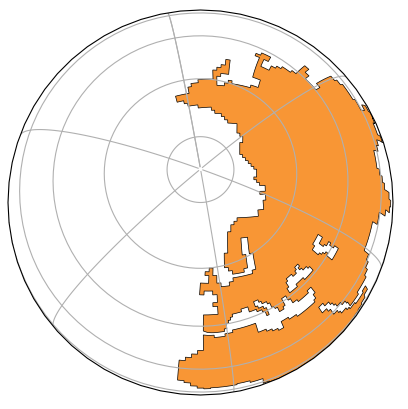
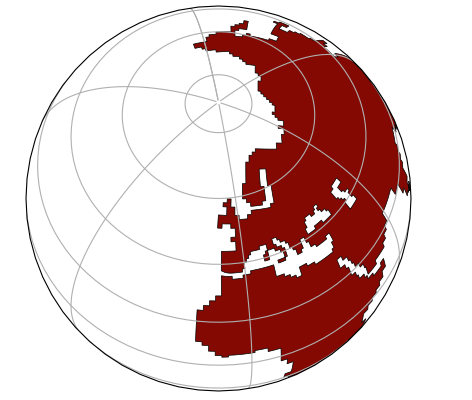
With map_proj = ccrs.Orthographic(-10, 60)
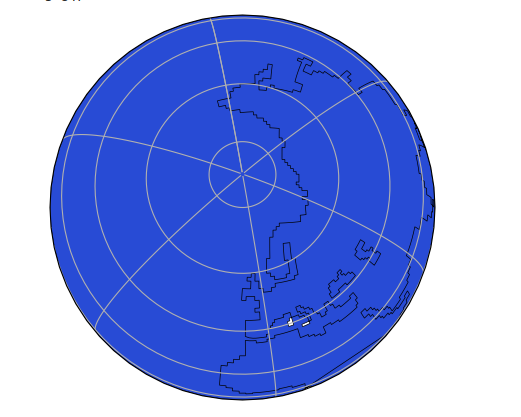
With map_proj = ccrs.Orthographic(-10, 80)
The previous example works with another input files where
all self intersected polygons have been separated.
wget -nc https://thredds-su.ipsl.fr/thredds/fileServer/ipsl_thredds/brocksce/tmp/polys_03.pickle
See details from answer given in
https://discourse.vtk.org/t/create-separated-regions-from-polydata
import matplotlib.pyplot as plt
from matplotlib.path import Path
from matplotlib.patches import PathPatch
import shapely
from shapely import geometry
import cartopy.crs as ccrs
import random
import pickle

#-----------------------------------------
! wget -nc https://thredds-su.ipsl.fr/thredds/fileServer/ipsl_thredds/brocksce/tmp/polys_03.pickle

with open('./polys_03.pickle', "rb") as poly_file:
    polygons = pickle.load(poly_file)

#-----------------------------------------
def polygon2patch(poly, **kwargs):
    path = Path.make_compound_path(
           Path(poly.exterior.coords, closed=True),
           *[Path(ring.coords) for ring in poly.interiors])
    patch = PathPatch(path, **kwargs)
    return patch

#-----------------------------------------
fig = plt.figure(figsize=(10,5))

map_proj = ccrs.Orthographic(-10, 80)
#map_proj = ccrs.Orthographic(-10, 60)
ax = fig.add_subplot(1, 1, 1, projection=map_proj)

transform = ccrs.Geodetic()

holesNumber = []
for n,polygonA in enumerate(polygons):
    if n != 16: continue
    holes = []
    for m,polygonB in enumerate(polygons):
        if (m == n): continue
        if polygonA.contains(polygonB):
            holes.append(polygonB.exterior.coords)
            holesNumber.append(m)
    if n in holesNumber: continue  # n is a hole
    polygonNew = geometry.Polygon(polygonA.exterior.coords, holes=holes)
    polygonNew = shapely.geometry.polygon.orient(polygonNew)   # Orient to be oriented counter-clockwise
    random_color = "#"+''.join([random.choice('0123456789ABCDEF') for i in range(6)])
    patch = polygon2patch(polygonNew, transform=transform, facecolor=random_color, lw=0.5, edgecolor="black")
    ax.add_patch(patch)

ax.set_global()
ax.gridlines()
plt.show()