Hi devs,
Coloring a scalar field that spans several orders of magnitude gets tricky when the range crosses zero. A linear scale can compress small variations into a few color bins. A logarithmic scale helps with the dynamic range, but cannot represent a range that crosses zero. To get the best of both worlds, the new symmetric logarithm (symlog) color scaling mode in VTK is now merged in https://gitlab.kitware.com/vtk/vtk/-/merge_requests/13792
Here is a comparison using the motorbike and truck datasets:
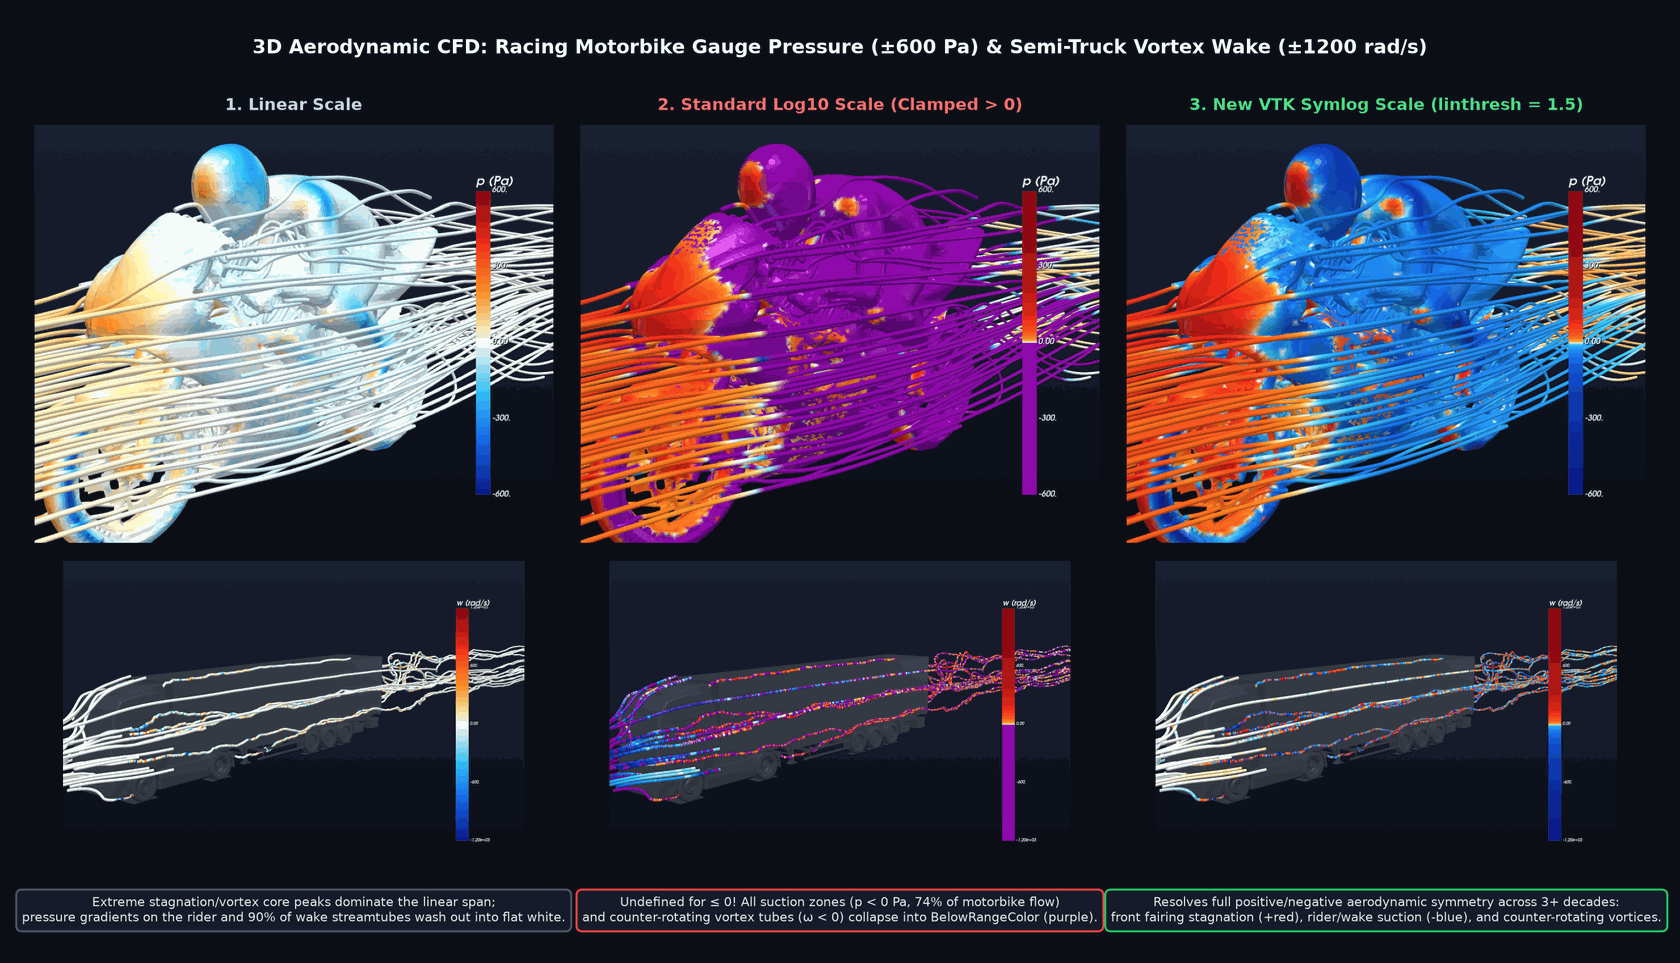
Left to right: linear, Log10, and symlog. Each row uses the same data and color palette. The Log10 examples use a positive-only mapping range, with values below that range shown in purple. Symlog retains color variation on both sides of zero.
With the full linear range, much of the pressure variation around the rider and in the wake is close to the middle of the color map. Symlog gives those smaller variations more room while
keeping the large positive and negative values in the same view.
The mapping uses a smooth, signed logarithm:
SymlogLinearThreshold sets the scale of the transition. For magnitudes much smaller than this threshold, the mapping is approximately linear. Farther from zero, it becomes logarithmic. Reducing the threshold gives small values more color variation; increasing it keeps a wider neighborhood of zero close to linear. The threshold is expressed in the same units as the scalar field.
This also makes signed image intensities an interesting application. The comparison below shows a CBCT dataset as a volume rendering and a slice. The color mapping changes across columns;
the volume’s opacity settings stay fixed.
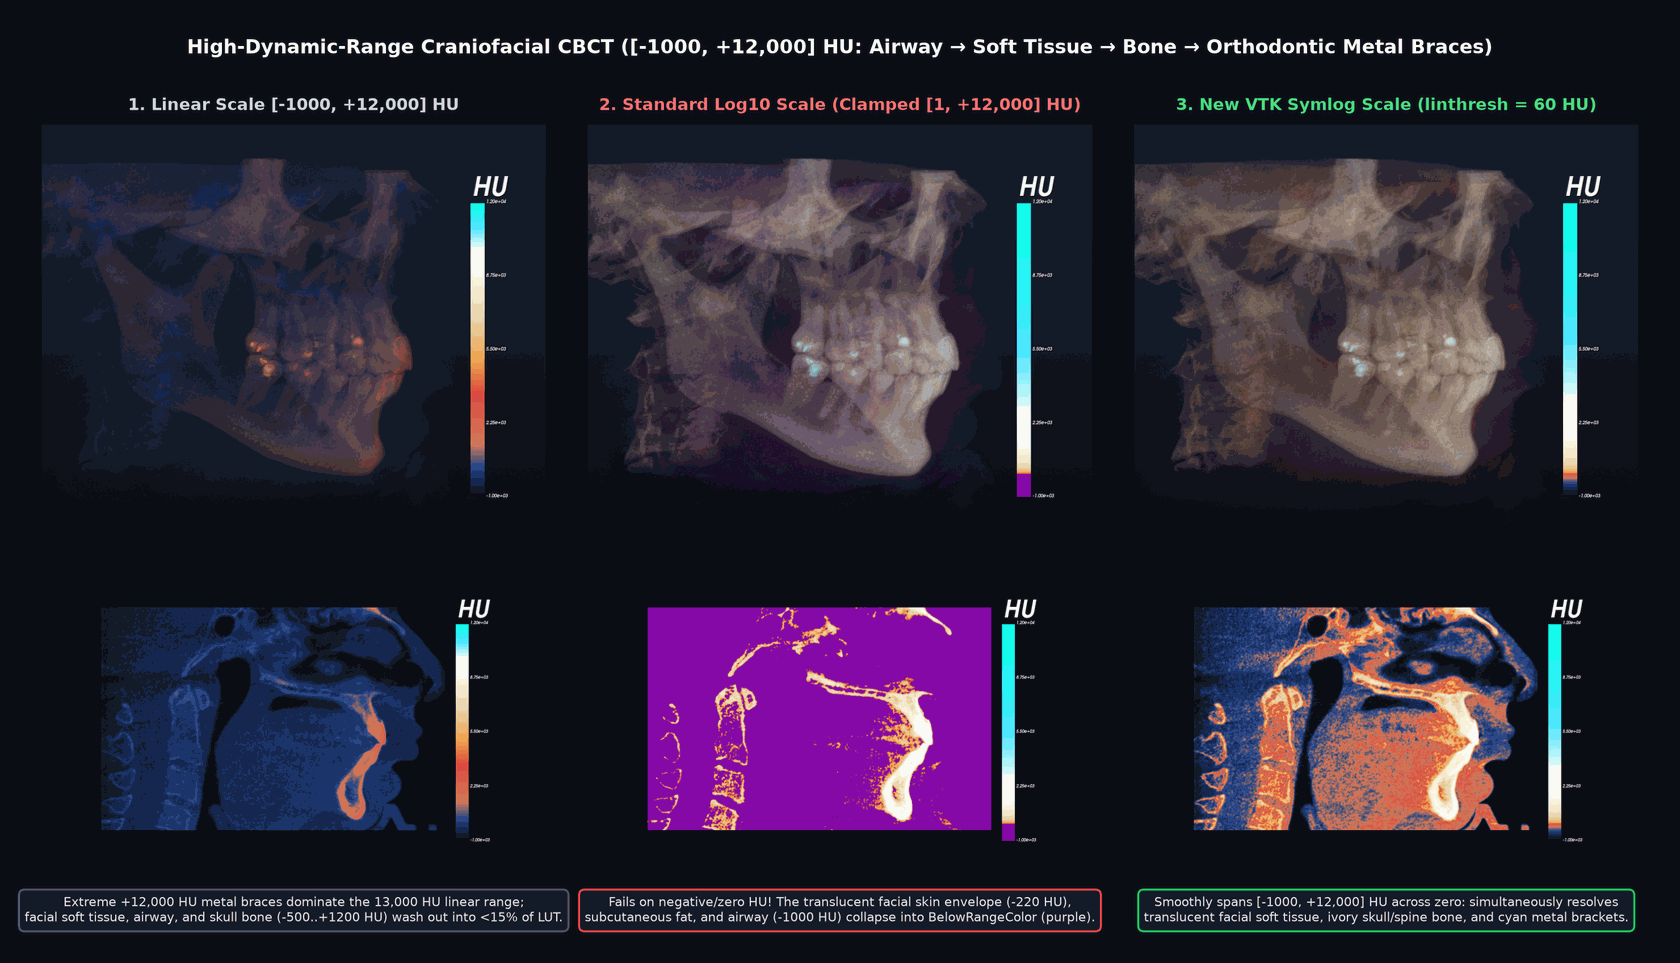
Linear, positive-only Log10, and symlog color mapping of a CBCT volume and slice
Symlog spans the negative and positive intensities in one mapping. In the slice, the purple region in the Log10 example shows values below its positive-only mapping range.
Both classes expose the same controls. For example, with a build from current master:
  import vtk

  lut = vtk.vtkLookupTable()
  lut.SetTableRange(-600.0, 600.0)
  lut.SetScaleToSymlog()
  lut.SetSymlogLinearThreshold(1.5)
  lut.Build()

  ctf = vtk.vtkColorTransferFunction()
  ctf.SetScaleToSymlog()
  ctf.SetSymlogLinearThreshold(1.5)
  ctf.AddRGBPoint(-600.0, 0.1, 0.3, 0.8)
  ctf.AddRGBPoint(0.0, 0.95, 0.95, 0.95)
  ctf.AddRGBPoint(600.0, 0.8, 0.2, 0.1)
The scaling happens in the color mapping, so the dataset and transfer-function control points stay in their original scalar units. You can choose the color palette separately from the scale.
There is also a small Trame comparison app in GitHub - sankhesh/ColorMapLUT: Trame project to test and synchronize vtkLookupTable and vtkColorTransferFunction functionalities. · GitHub for exploring the mapping and threshold settings.