Hello, everyone!
We use VTK on several projects in my company and recently, during an upgrade from VTK-6.3.0 to VTK-9.3.0, a bug was found. I have already debugged the VTK source hoping that I could find a fix for it but I didn’t find the root cause so, I decided to write a code snippet to bring up the issue looking for help.
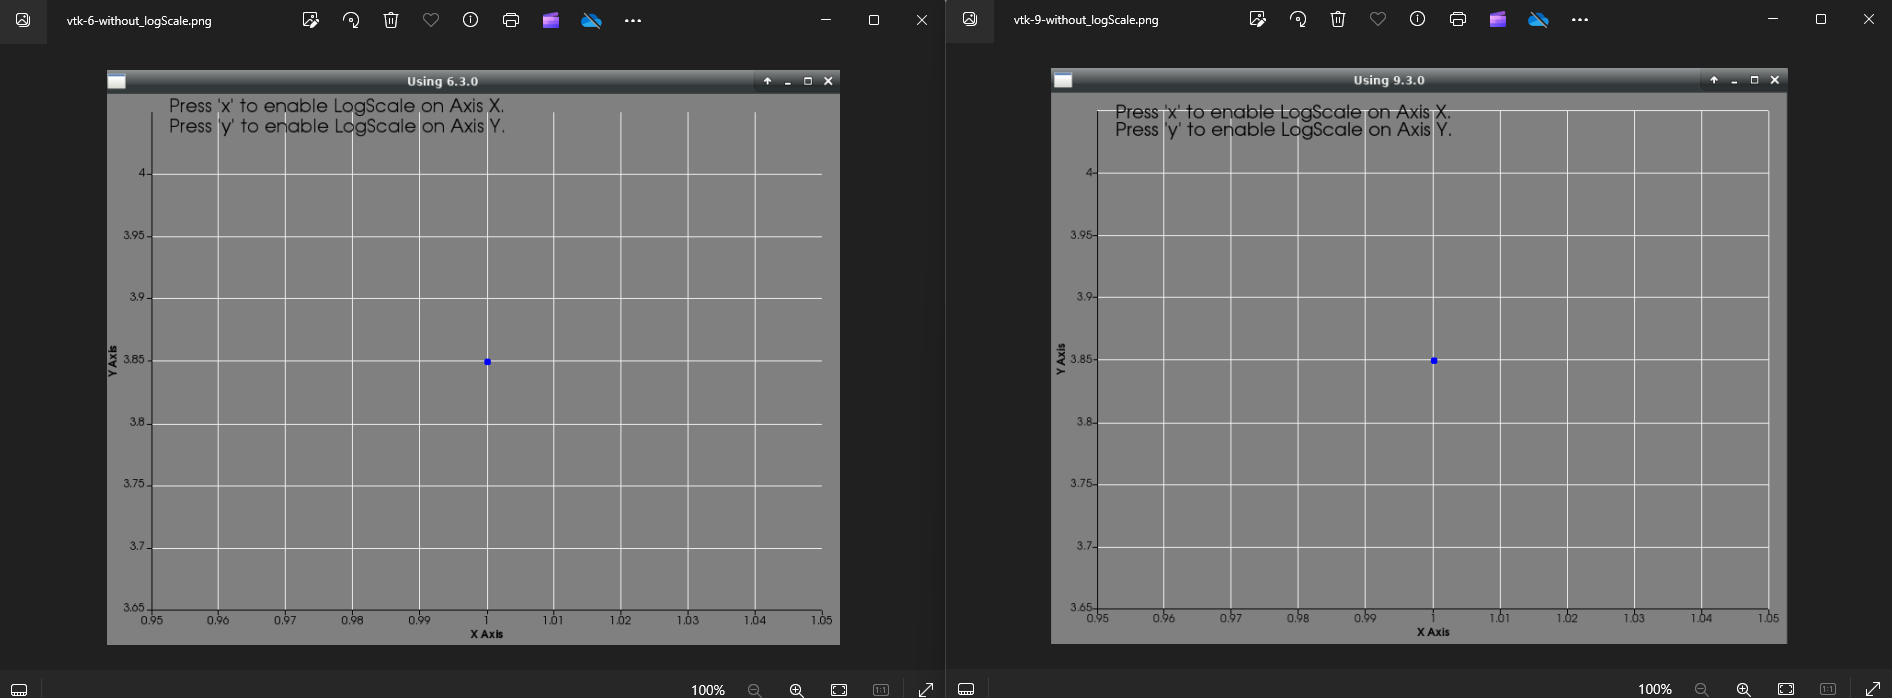
When plotting one or several points using vtkChartXY I can see the chart with the expected points. It works correctly on both VTK versions (6.3.0 and 9.3.0). Note the window title holds the used VTK version.
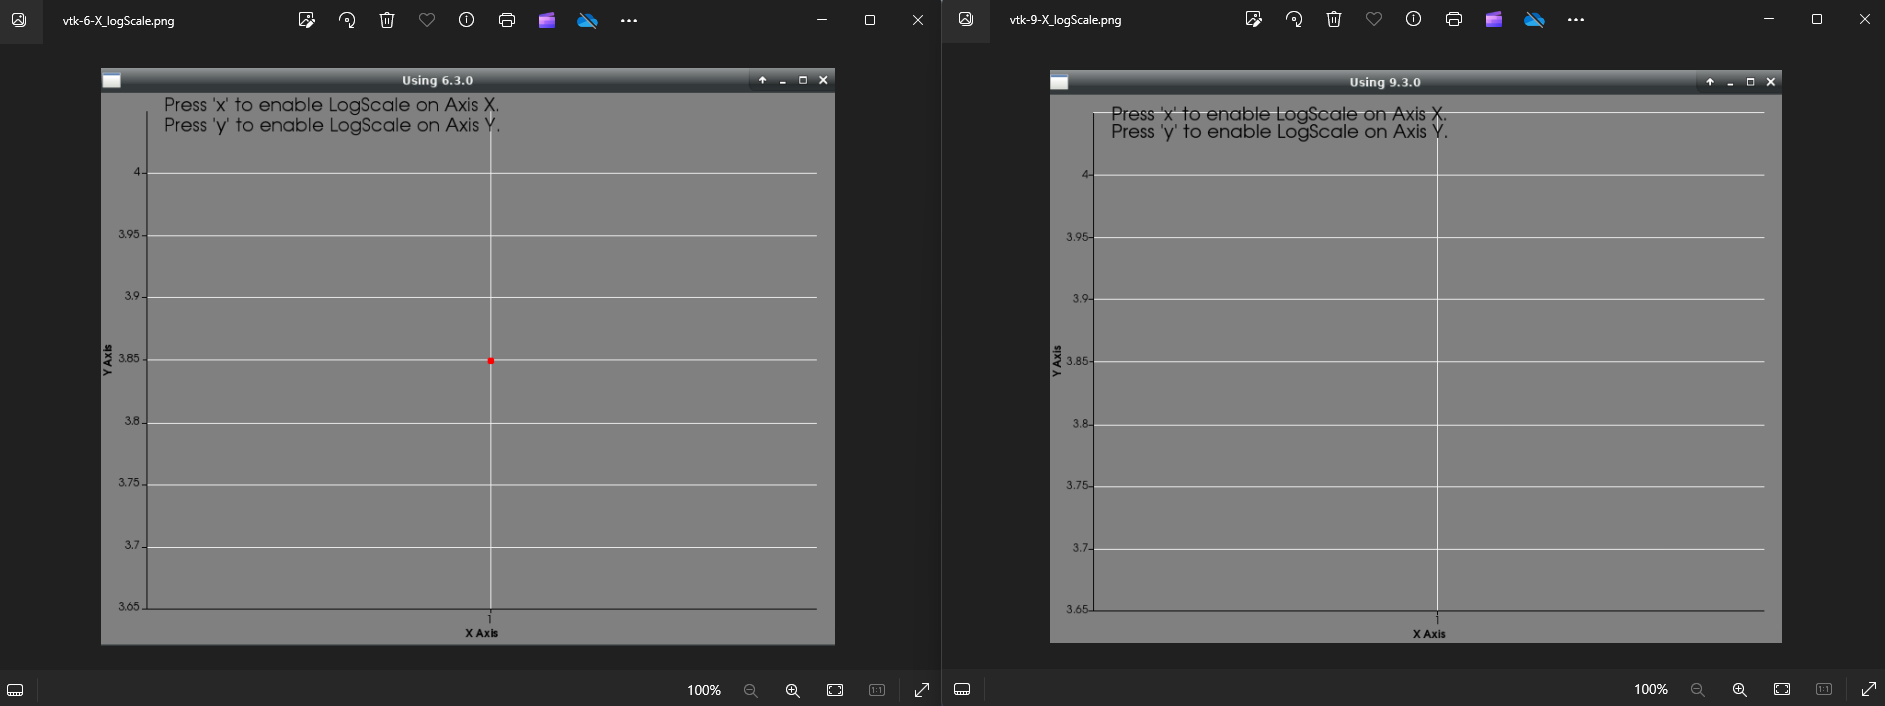
Enabling the log scale for axis X works as expected on VTK-6.3.0 but not on VTK-9.3.0
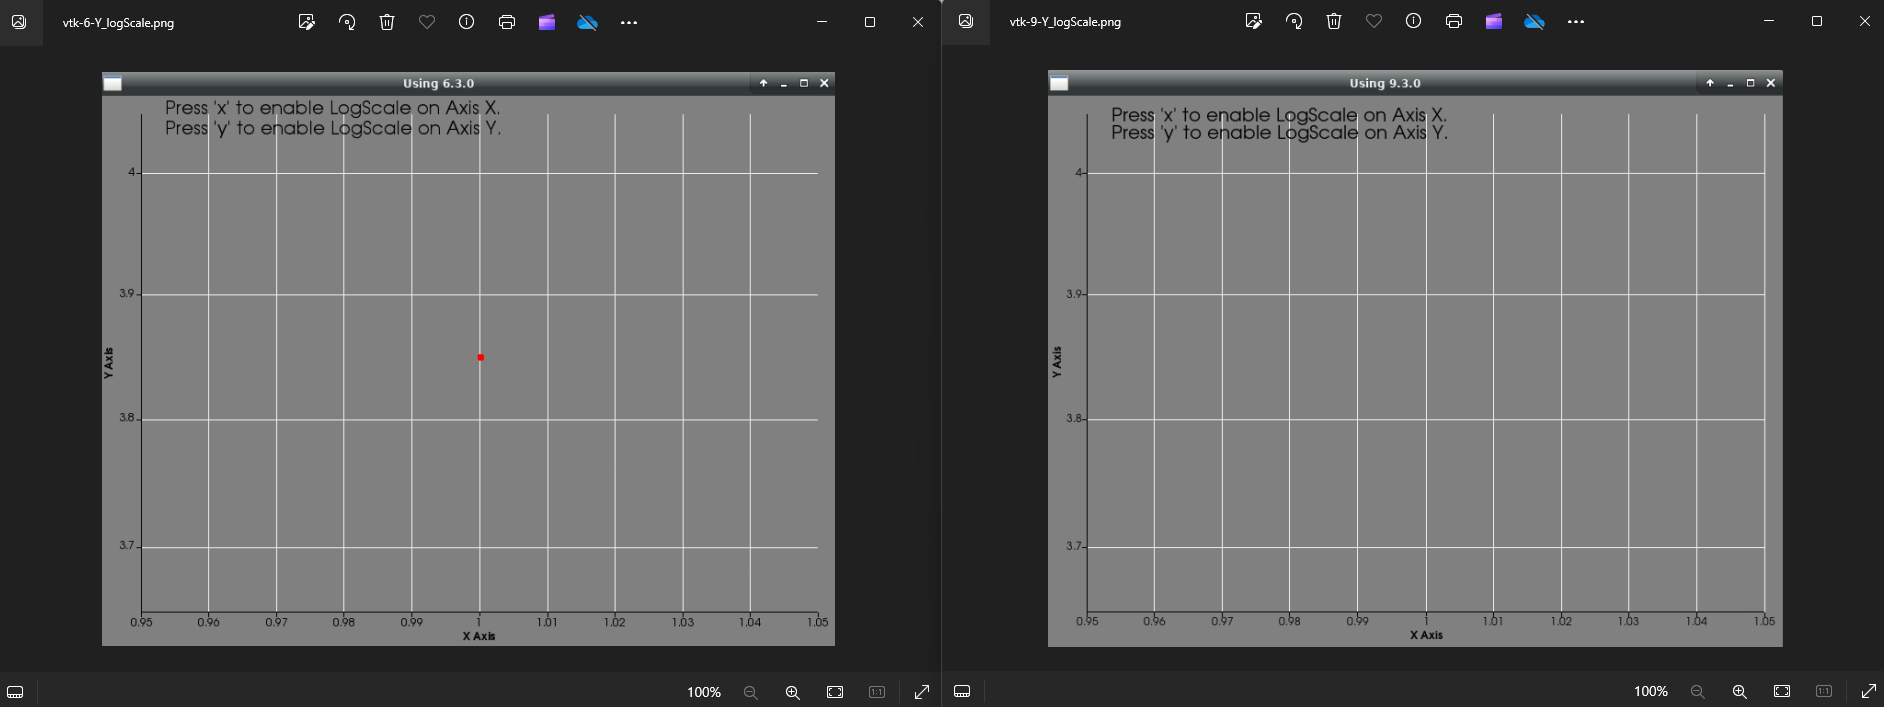
The same for axis Y.
My system info:
Red Hat 7.9
GCC 12.2.1
cmake 3.29.3
VTK built from source
Code snippet:
Blockquote
#include “vtkContextActor.h”
#include <vtkSmartPointer.h>
#include <vtkChartXY.h>
#include <vtkContextScene.h>
#include <vtkRenderWindow.h>
#include <vtkRenderWindowInteractor.h>
#include <vtkRenderer.h>
#include <vtkAxis.h>
#include <vtkPlot.h>
#include <vtkTable.h>
#include <vtkFloatArray.h>
#include <vtkNamedColors.h>
#include <vtkPen.h>
#include <vtkCallbackCommand.h>
#include <vtkVersion.h>
#include <vtkTextActor.h>
#include <vtkTextProperty.h>
void ClickCallbackFunction(vtkObject* caller, long unsigned int eventId,
void* clientData, void* callData);
// Create a chart
vtkSmartPointer chart = vtkSmartPointer::New();
vtkSmartPointer table = vtkSmartPointer::New();
int main()
{
vtkSmartPointer colors = vtkSmartPointer::New();
// Create a text actor.
vtkSmartPointer txt = vtkSmartPointer::New();;
txt->SetInput(“Press ‘x’ to enable LogScale on Axis X.\nPress ‘y’ to enable LogScale on Axis Y.\n”);
vtkTextProperty* txtprop = txt->GetTextProperty();
txtprop->SetFontFamilyToArial();
txtprop->SetFontSize(20);
txtprop->SetColor(colors->GetColor3d(“Black”).GetData());
txt->SetDisplayPosition(70, 530);
// Create a table with some points
vtkSmartPointer x = vtkSmartPointer::New();
x->SetName(“X”);
vtkSmartPointer y = vtkSmartPointer::New();
y->SetName(“Y”);
table->AddColumn(x);
table->AddColumn(y);
// table->SetNumberOfRows(1);
// table->SetValue(0, 0, 1);
// table->SetValue(0, 1, 3.8486);
auto numPoints = 10;
double inc = 0.5;
table->SetNumberOfRows(numPoints);
for (double i = 0.0; i < numPoints; ++i)
{
table->SetValue(i, 0, i + 1);
table->SetValue(i, 1, i + 1 + inc);
}
auto points = chart->AddPlot(vtkChart::POINTS);
points->SetInputData(table, 0, 1);
points->SetColor(0,0,1);
// Create a renderer and render window
vtkSmartPointer renderer = vtkSmartPointer::New();
vtkSmartPointer renderWindow = vtkSmartPointer::New();
renderWindow->AddRenderer(renderer);
vtkSmartPointer clickCallback = vtkSmartPointer::New();
clickCallback->SetCallback(ClickCallbackFunction);
// Create a render window interactor
vtkSmartPointer interactor = vtkSmartPointer::New();
interactor->SetRenderWindow(renderWindow);
interactor->AddObserver(vtkCommand::KeyPressEvent,
clickCallback);
// Add the chart to the renderer
vtkSmartPointer scene = vtkSmartPointer::New();
scene->AddItem(chart);
vtkSmartPointer actorChart = vtkSmartPointer::New();
actorChart->SetScene(scene);
renderer->AddActor(actorChart);
renderer->AddActor(txt);
renderer->SetBackground(colors->GetColor3d(“Gray”).GetData());
// Render and interact
renderWindow->SetSize(800,600);
renderWindow->SetWindowName(std::string("Using ").append(vtkVersion::GetVTKVersion()).c_str());
renderWindow->Render();
interactor->Initialize();
interactor->Start();
return 0;
}
void ClickCallbackFunction(vtkObject* caller,
long unsigned int eventId,
void* vtkNotUsed(clientData),
void* vtkNotUsed(callData))
{
vtkRenderWindowInteractor* iren = static_cast<vtkRenderWindowInteractor*>(caller);
// std::cout << "Pressed: " << iren->GetKeySym() << std::endl;
// std::cout << “Click callback” << std::endl;
// std::cout << "Event: " << vtkCommand::GetStringFromEventId(eventId) << std::endl;
bool log10XOn = chart->GetAxis(vtkAxis::BOTTOM)->GetLogScale();
bool log10YOn = chart->GetAxis(vtkAxis::LEFT)->GetLogScale();
std::string pressed = iren->GetKeySym();
if( pressed.compare(“x”) == 0) {
log10XOn = !log10XOn;
auto points = chart->GetPlot(0);
if(!log10XOn) {
points->SetInputData(table, 0, 1);
points->SetColor(0,0,1);
} else {
vtkSmartPointer vLogXLogYTable = vtkSmartPointer::New();
vLogXLogYTable->DeepCopy(table);
for (auto j = 0; j < vLogXLogYTable->GetNumberOfRows(); j++){
double val = vLogXLogYTable->GetValue(j, 0).ToDouble();
if ((val <= 0)||(std::abs(val)<=1.0e-300)){
vLogXLogYTable->SetValue(j, 0, std::numeric_limits::quiet_NaN());
}
val = vLogXLogYTable->GetValue(j, 1).ToDouble();
if ((val <= 0)||(std::abs(val)<=1.0e-300)){
vLogXLogYTable->SetValue(j, 1, std::numeric_limits::quiet_NaN());
}
}
points->SetInputData(vLogXLogYTable, 0, 1);
points->SetColor(1.0,0,0);
}
if(!log10YOn && !log10XOn) {
points->SetColor(0,0,1);
}
else{
points->SetColor(1.0,0,0);
}
chart->GetAxis(vtkAxis::BOTTOM)->SetLogScale(log10XOn);
}
else if( pressed.compare(“y”) == 0) {
log10YOn = !log10YOn;
auto points = chart->GetPlot(0);
if(!log10YOn) {
points->SetInputData(table, 0, 1);
} else {
vtkSmartPointer vLogXLogYTable = vtkSmartPointer::New();
vLogXLogYTable->DeepCopy(table);
for (auto j = 0; j < vLogXLogYTable->GetNumberOfRows(); j++){
double val = vLogXLogYTable->GetValue(j, 0).ToDouble();
if ((val <= 0)||(std::abs(val)<=1.0e-300)){
vLogXLogYTable->SetValue(j, 0, std::numeric_limits::quiet_NaN());
}
val = vLogXLogYTable->GetValue(j, 1).ToDouble();
if ((val <= 0)||(std::abs(val)<=1.0e-300)){
vLogXLogYTable->SetValue(j, 1, std::numeric_limits::quiet_NaN());
}
}
points->SetInputData(vLogXLogYTable, 0, 1);
}
if(!log10YOn && !log10XOn) {
points->SetColor(0,0,1);
}
else{
points->SetColor(1.0,0,0);
}
chart->GetAxis(vtkAxis::LEFT)->SetLogScale(log10YOn);
}
iren->Render();
}
Cleaning and re-adding plots is not an option for us. I would appreciate any help on this matter.
Cheers,
Eduardo