Hey everyone,
I’m new to VTK and want to use it for data visualization,
I created my vtkContextView loaded with a vtkChartXY that contains x vtkPlotLine
i then implemented my own vtkContextInteractor to craete my own interactions
i have 2 kinds of zoom, the mouse wheeling that reduce/increase the axes range by 10%
or a rect zoom that uses the selection to zoom on the selected area
every thing work perfectly, but when zooming too much (no precise situation/zoom ratio) the points positions are suddenly messed up, the 2d transformation seems to be the cause but i cannot find a turnaround for this. i’m using vtk9.3 and using mainly the Chart Core module of vtk.
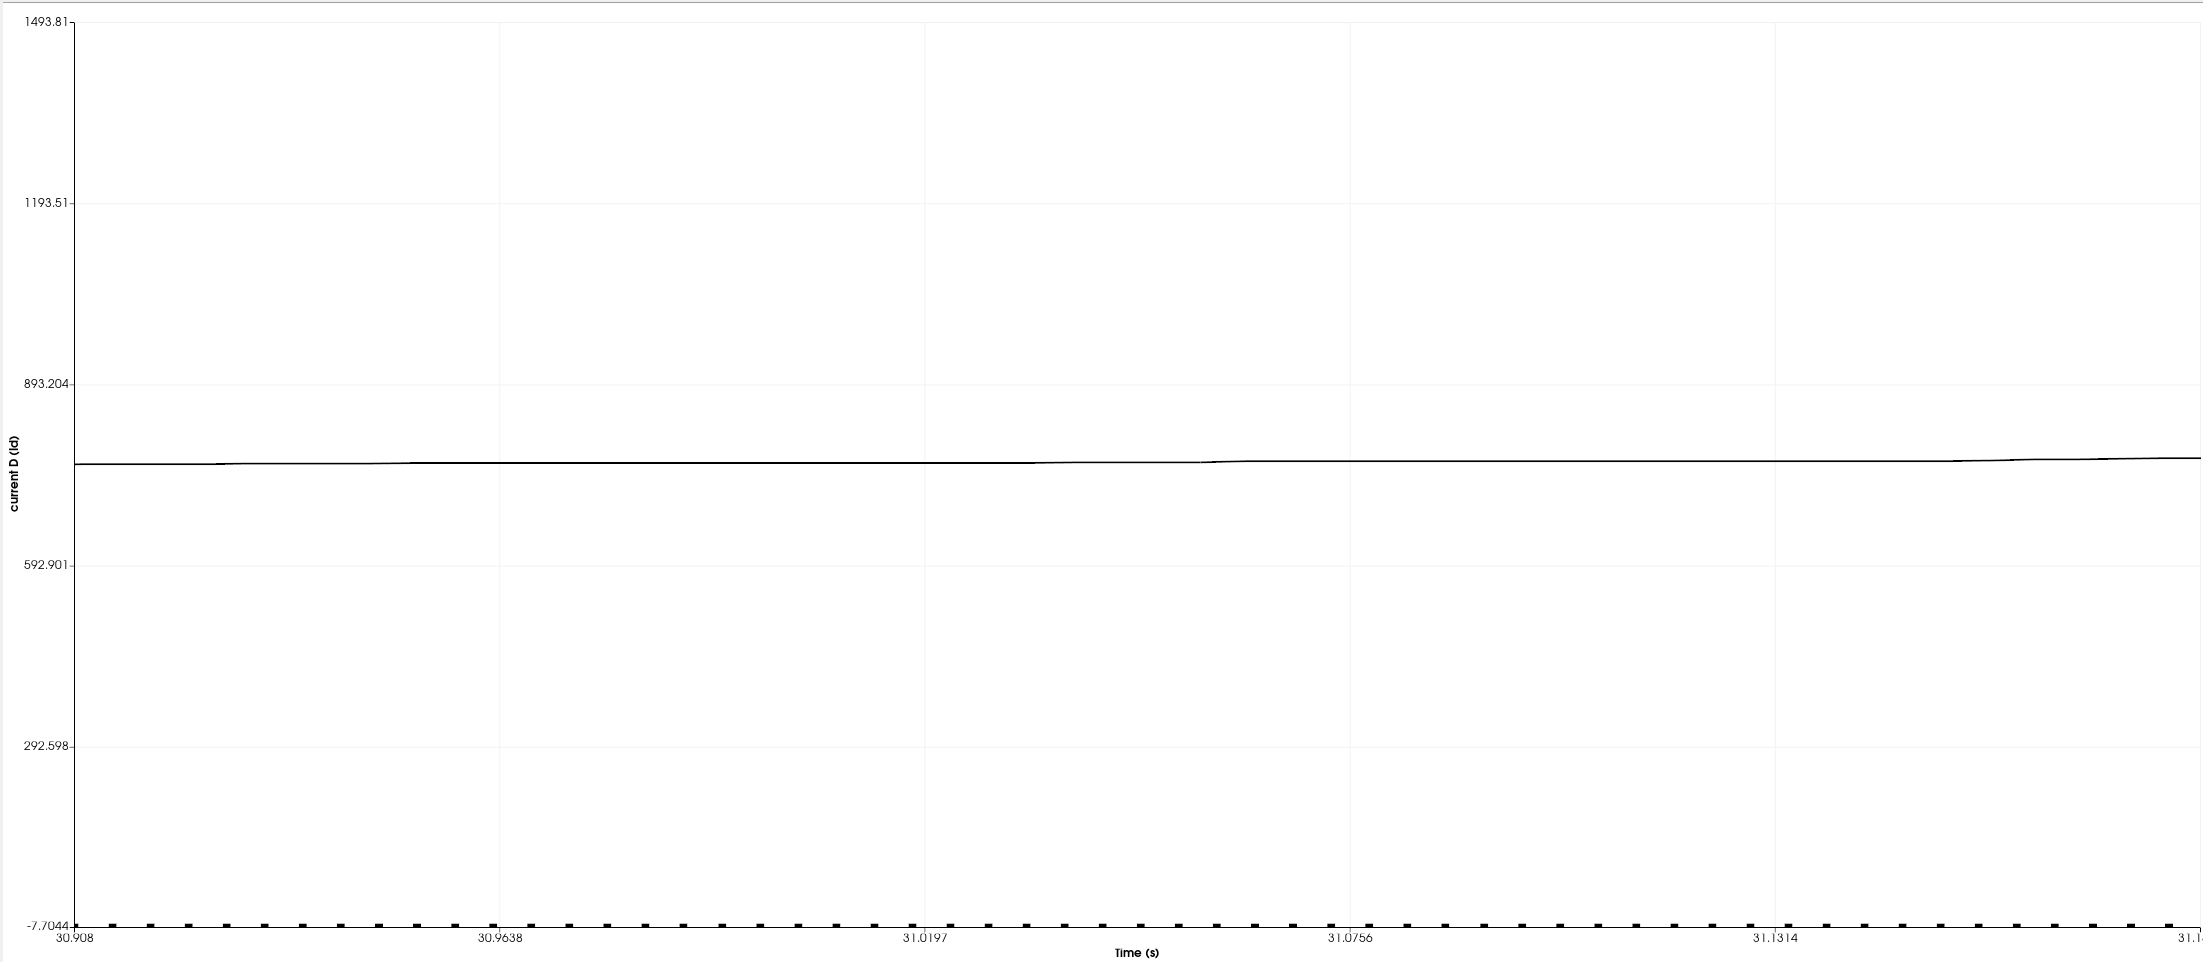
the line is the correct position while the markers below are just wrong
Thank you for your help!