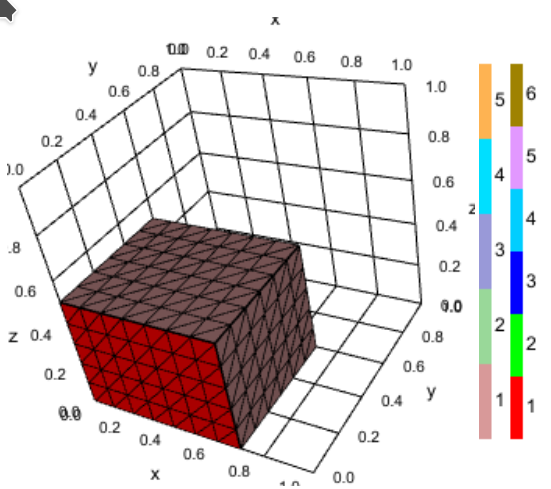
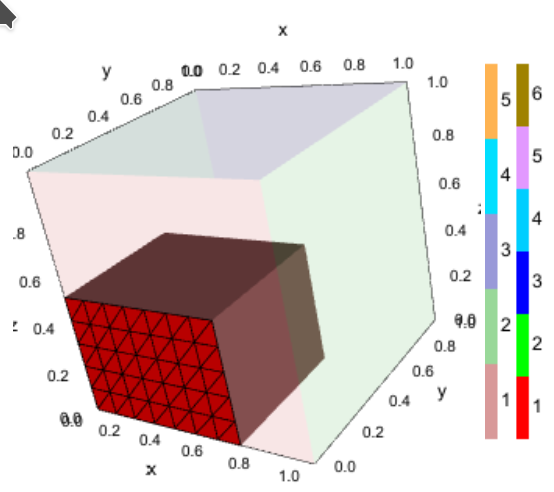
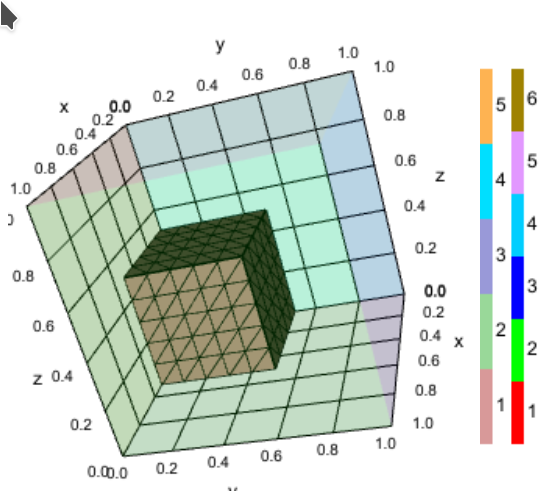
Hi, I am trying to incorporate vtk.js into Julia Pluto notebooks, see https://github.com/j-fu/PlutoVista.jl. I want to plot cuts of 3d meshes (and later on function isosurfaces), and in addition, a transparent outline of the mesh boundary. I am plotting the cuts twice: as surface, and as wireframe. If I switch on the outline plot, the wireframe becomes invisible:
Plot without outline:

Plot with outline:

I define the outline dataset via
                var ocolorData = vtk.Common.Core.vtkDataArray.newInstance({
                    name: 'Colors',
                    values: ocolors,
                    numberOfComponents: 4,
                });
...
                    win.odataset = vtk.Common.DataModel.vtkPolyData.newInstance();
                    win.oactor = vtk.Rendering.Core.vtkActor.newInstance();
		    var omapper = vtk.Rendering.Core.vtkMapper.newInstance();
		    omapper.setInputData(win.odataset);
                    omapper.setColorModeToDirectScalars()
		    win.oactor.setMapper(omapper);
                    win.renderer.addActor(win.oactor);


                win.odataset.getPoints().setData(opoints, 3);
                win.odataset.getPolys().setData(opolys,1);
                win.odataset.getCellData().setActiveScalars('Colors');
                win.odataset.getCellData().setScalars(ocolorData);
and the wireframe dataset via
                win.dataset = vtk.Common.DataModel.vtkPolyData.newInstance();
                win.actor = vtk.Rendering.Core.vtkActor.newInstance();
		var mapper = vtk.Rendering.Core.vtkMapper.newInstance();
                mapper.setColorModeToDefault()
		win.actor.getProperty().setRepresentation(1);
		win.actor.getProperty().setColor(0, 0, 0);
		win.actor.getProperty().setLineWidth(1.5);
		mapper.setInputData(win.dataset);
		win.actor.setMapper(mapper);
		win.renderer.addActor(win.actor);

                win.dataset.getPoints().setData(points, 3);
                win.dataset.getPolys().setData(polys,1);
                win.dataset.modified()
Any hints ?
(Anyway: thanks for the great work!)
