Greetings,
I’m a VTK beginner, seeking help with getting the ParallelCoordinatesView example working with input data from an HDF file:
https://examples.vtk.org/site/Python/InfoVis/ParallelCoordinatesView/
The interactions provided, where one can select bundles of lines by dragging, will hopefully be the basis for an interactive sonification.
To prepare, I created a VTK HDF file containing a single data array as ImageData. This was following the overview at:
https://docs.vtk.org/en/latest/design_documents/VTKFileFormats.html
The array has two significant dimensions, one corresponding to data cases and the other to variables. I would like to display a parallel axis for each variable. (Details on the creation of this file: way at the bottom).
Following the original example, I created a vtkHDFReader and mapped its output port to the vtkParallelCoordinatesRepresentation. But following that, I don’t know how to map slices of my data array to different parallel axes. So, at the moment, my parallel coordinates plot is empty.
How do I map different slices of my HDF dataset to axes on the parallel coordinates plot?
Here is the current code:
"Example for viewing HDF data with parallel coordinates."
#!/usr/bin/env python
# Example of how to use Parallel Coordinates View to plot and compare
# data set attributes.
# Use the 'u' character to toggle between 'inspect modes' on the parallel
# coordinates view (i.e. between selecting data and manipulating axes).
# Lines which are commented out show alternative options.
# noinspection PyUnresolvedReferences
import vtkmodules.vtkInteractionStyle
from vtkmodules.vtkIOHDF import vtkHDFReader
# noinspection PyUnresolvedReferences
import vtkmodules.vtkRenderingOpenGL2
from vtkmodules.vtkCommonColor import vtkNamedColors
from vtkmodules.vtkFiltersCore import vtkElevationFilter
from vtkmodules.vtkFiltersGeneral import vtkBrownianPoints
from vtkmodules.vtkImagingCore import vtkRTAnalyticSource
from vtkmodules.vtkImagingGeneral import vtkImageGradient
from vtkmodules.vtkViewsInfovis import (
vtkParallelCoordinatesRepresentation,
vtkParallelCoordinatesView
)
def main():
colors = vtkNamedColors()
# Generate an example image data set with multiple attribute arrays to probe
# and view.
# This is where you would put your reader instead of this rt->elev pipeline...
# rt = vtkRTAnalyticSource()
# rt.SetWholeExtent(-3, 3, -3, 3, -3, 3)
# grad = vtkImageGradient()
# grad.SetDimensionality(3)
# grad.SetInputConnection(rt.GetOutputPort())
# brown = vtkBrownianPoints()
# brown.SetMinimumSpeed(0.5)
# brown.SetMaximumSpeed(1.0)
# brown.SetInputConnection(grad.GetOutputPort())
# elev = vtkElevationFilter()
# elev.SetLowPoint(-3, -3, -3)
# elev.SetHighPoint(3, 3, 3)
# elev.SetInputConnection(brown.GetOutputPort())
reader = vtkHDFReader()
reader.SetFileName("dust_vtk.hdf")
reader.Update()
# mapper = vtkPolyDataMapper()
# mapper.SetInputConnection(reader.GetOutputPort())
# Set up the parallel coordinates Representation to be used in the View
rep = vtkParallelCoordinatesRepresentation()
# Plug your reader in here for your own data
rep.SetInputConnection(reader.GetOutputPort())
# List all of the attribute arrays you want plotted in parallel coordinates
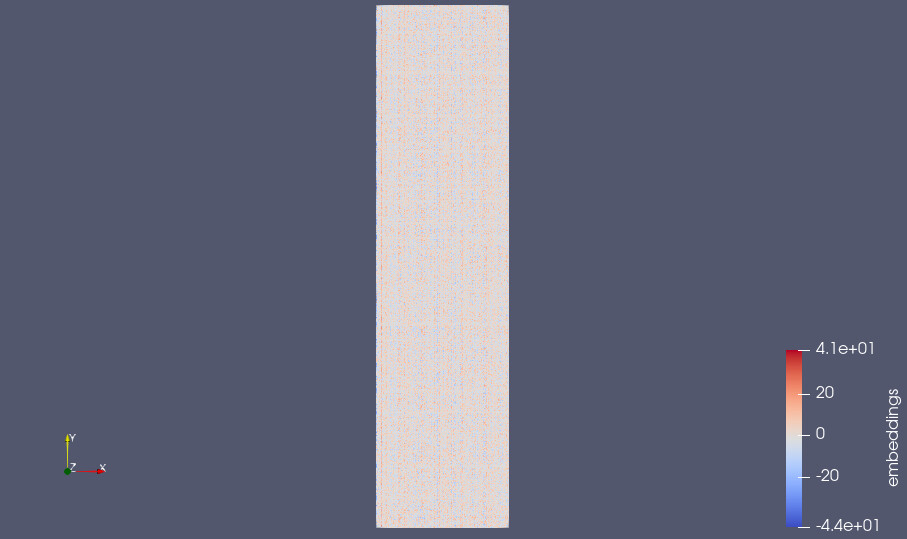
rep.SetInputArrayToProcess(0, 0, 0, 0, 'embeddings')
# rep.SetInputArrayToProcess(1, 0, 0, 0, 'RTData')
# rep.SetInputArrayToProcess(2, 0, 0, 0, 'Elevation')
# rep.SetInputArrayToProcess(3, 0, 0, 0, 'BrownianVectors')
rep.SetUseCurves(0) # set to 1 to use smooth curves
rep.SetLineOpacity(0.5)
rep.SetAxisColor(colors.GetColor3d('Gold'))
rep.SetLineColor(colors.GetColor3d('MistyRose'))
# Set up the Parallel Coordinates View and hook in the Representation
view = vtkParallelCoordinatesView()
view.SetRepresentation(rep)
# Inspect Mode determines whether your interactions manipulate the axes or
# select data
# view.SetInspectMode(view.VTK_INSPECT_MANIPULATE_AXES) # VTK_INSPECT_MANIPULATE_AXES = 0,
view.SetInspectMode(view.VTK_INSPECT_SELECT_DATA) # VTK_INSPECT_SELECT_DATA = 1
# Brush Mode determines the type of interaction you perform to select data
view.SetBrushModeToLasso()
# view.SetBrushModeToAngle()
# view.SetBrushModeToFunction()
# view.SetBrushModeToAxisThreshold() # not implemented yet (as of 21 Feb 2010)
# Brush Operator determines how each new selection interaction changes
# selected lines
# view.SetBrushOperatorToAdd()
# view.SetBrushOperatorToSubtract()
# view.SetBrushOperatorToIntersect()
view.SetBrushOperatorToReplace()
def ToggleInspectors(obj, event):
# Define the callback routine which toggles between 'Inspect Modes'
if view.GetInspectMode() == 0:
view.SetInspectMode(1)
else:
view.SetInspectMode(0)
# Hook up the callback to toggle between inspect modes
# (manip axes & select data)
view.GetInteractor().AddObserver('UserEvent', ToggleInspectors)
# Set up render window
view.GetRenderWindow().SetSize(600, 300)
view.GetRenderWindow().SetWindowName('ParallelCoordinatesView')
view.GetRenderer().GradientBackgroundOn()
view.GetRenderer().SetBackground2(colors.GetColor3d('DarkBlue'))
view.GetRenderer().SetBackground(colors.GetColor3d('MidnightBlue'))
view.ResetCamera()
view.Render()
# Start interaction event loop
view.GetInteractor().Start()
if __name__ == '__main__':
main()
Here is some of the h5py code to initialize the VTKHDF file:
#setup code comes before this

dbFile = h5py.File("dust_vtk.hdf", "w")
top = dbFile.create_group("VTKHDF")
top.attrs["Type"] = np.array( "ImageData".encode("ascii") )
top.attrs["Version"] = [2,2]
top.attrs["WholeExtent"] = [0,256-1,0,num_blocks-1,0,0]
top.attrs["Origin"] = [0,0,0]
top.attrs["Direction"] = (1.0, 0.0, 0.0, 0.0, 1.0, 0.0, 0.0, 0.0, 1.0)
top.attrs["Spacing"] = [1,1,1]

pdata = top.create_group("PointData")
pdata.attrs["Scalars"] = np.array( "embeddings".encode("ascii") )

#ids = pdata.create_dataset("speaker_id", (num_blocks,), dtype="i")
embeddings = pdata.create_dataset("embeddings", (num_blocks,ndim,1), dtype='f')

#writing embeddings comes after this
best regards,
Graham