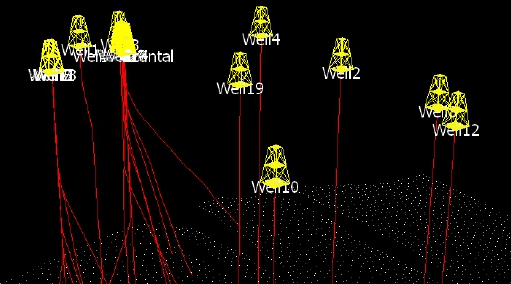
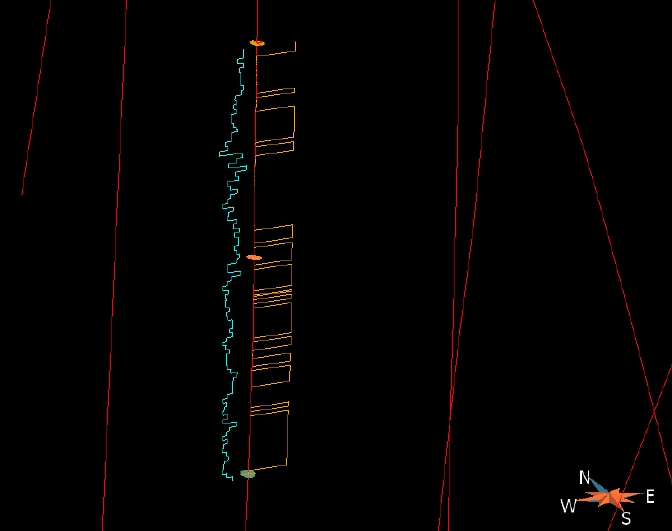
Hello, we are building a geological visualization application and we need to visualize borehole/well logs, i.e. parameters recorded along a borehole or a well in the subsurface. The borehole geometry is represented by a polyline (some boreholes are deviated with respect to the vertical axis), i.e. a polydata with polyline cells (possibly a single cell). The parameters should be plot as a sort of “flag plot” on one or both sides of the borehole trace (the symbol on top is not important and can be done with a Glyph):
The parameters have a different spatial resolution with respect the well geometry polyline (i.e. temperature measured every 20cm on a borehole where the geometry polyline is recorded every 1m).
We expect to store the parameters on Numpy arrays with some sort of indication of the sampling step along the borehole geometric trace, and then plot as in the examples.
Does anybody have suggestions for this kind of plot?
Thanks very much!