Dear Community,
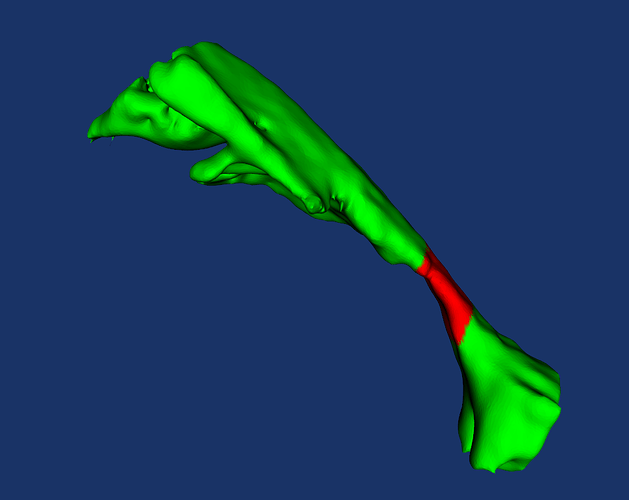
I am trying to color a 3D object by parsing each slice and affect a color if the width is > to a certain thershold. Or < to another one
Below the code that I try to modify in order to fit my needs. but this later won’t work for my case.
import vtk, sys
import statistics
# Read in your STL file
f = vtk.vtkSTLReader()
f.SetFileName("airways_no_labels.stl")
f.Update() # This is necessary to have the data ready to read.

# The vtkSTLReader reads in your file as a vtkPolyData, 'obj' is a reference to
# that output. I'm using the bounds that are automatically calculated during
# the import phase to give a range for the height of the points in the file.v
# I believe that the bounds are (xmin, xmax, ymin, ymax, zmin, zmax).
obj = f.GetOutputDataObject(0)
min_x , max_x , min_y , max_y ,min_z, max_z = obj.GetBounds()
# I am creating a lookup table to correspond to the height field. I am using
# the default values. Remember that the lookup table is a rather complex and
# handy object, and there are lots of options to set if you need something
# special.
lut_z = vtk.vtkLookupTable()
lut_z.SetTableRange(min_z, max_z)
lut_z.Build()

lut_x = vtk.vtkLookupTable()
lut_x.SetTableRange(min_x, max_x)
lut_x.Build()

lut_y = vtk.vtkLookupTable()
lut_y.SetTableRange(min_y, max_y)
lut_y.Build()
# This is an array that I am creating to store the heights of the points. I
# will use this as a scalar field on the 'obj' so that the lookup  table can be
# used to color it. You could obviously make the array anything you wanted,
# such as ‘x’ or ‘y’ or squared distance from some other point, for instance.
X_median = vtk.vtkDoubleArray()
X_median.SetName("X_sum")

width = vtk.vtkDoubleArray()
width.SetName("X_Value")

heights = vtk.vtkDoubleArray()
heights.SetName("Z_Value")


width = vtk.vtkDoubleArray()
width.SetName("X_Value")
# Loop through the points in the vtkPolyData and record the height in the
# 'heights' array.
Colors = vtk.vtkUnsignedCharArray()
Colors.SetNumberOfComponents(3)
Colors.SetNumberOfTuples(obj.GetNumberOfCells())
test_xyz = []
test_z = []

for i in range(obj.GetNumberOfPoints()) :
    xyz = obj.GetPoint(i)
    test_xyz.append(xyz)

# Assign color by extracting each color
for i in range(obj.GetNumberOfPoints()):
    point = obj.GetPoint(i)
    # Get the color from lookup table
    color = [0]*3
    lut_z.GetColor(point[2],color)
    # print(point[0])
    # Convert each color to 255
    for j in range(len(color)):
        if min_x < point[0] < 350 : #problem here
            color[j] = (int(255 * color[j]))
            # print(color[j])

        if 350 <= point[0] <= max_x : # problem here
            color[j] = int(0 * color[j])
            # print(color[j])
    Colors.InsertTypedTuple(i,color)


# # Set Scalars
obj.GetPointData().SetScalars(Colors)

# Visualization stuff ... you need to tell the mapper about the scalar field
# and the lookup table. The rest of this is pretty standard stuff.
mapper = vtk.vtkPolyDataMapper()
mapper.SetInputDataObject(obj)
mapper.SetScalarRange(min_z, max_z)
mapper.SetLookupTable(lut_z)
mapper.SetUseLookupTableScalarRange(True)

actor = vtk.vtkActor()
actor.SetMapper(mapper)

renderer = vtk.vtkRenderer()
renderer.AddActor(actor)
renderer.SetBackground(.1, .2, .4)

renw = vtk.vtkRenderWindow()
renw.AddRenderer(renderer)

iren = vtk.vtkRenderWindowInteractor()
iren.SetRenderWindow(renw)

renw.Render()
iren.Start()
The purpose is to have something like that
