Hi!
I’m having a very hard time convincing VTK to color my data according to the supplied custom lookup table, and I would really appreciate some hints. The problem occurs when using the vtkTubeFilter: it seems that the tube colors between the points with defined scalar values are not interpolated from the lookup table, but rather some other interpolation method is used.
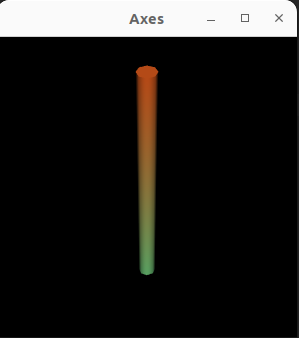
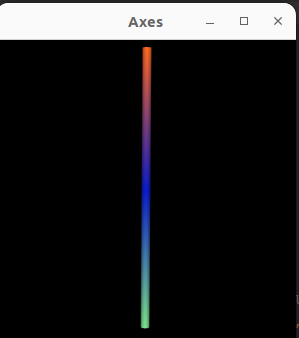
Consider this simple case: I have two points connected with a segment, I assign scalars to those points. I then build a vtkTubeFilter on top of that PolyData, and I set a custom 3-color lookup table on the mapper. The tube is colored, but the color space is wrong: it only spans from the first to the last color in the lookup table, and completely disregards the third color in the middle (see attached picture_2points). The correct coloring can be seen when I make a 3-point model, with 2 lines, and I color it with the same colormap (see the second picture_3points).
IMO, those two figures should be colored the same way, but you see that the middle part of the colormap is missing in the first 2-point case. I have attached the python code that generates those figures. Could someone help me to understand what am I doing wrong?
thanks!
main.py (3.5 KB)