Hi,guys,I am using VTK(c++) to visualize some results,I need to visualize the distribution of oil film forces on a cylinder surface,
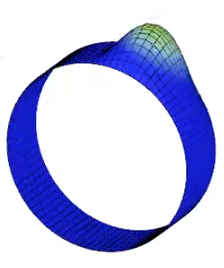 just like this picture.I already have a two-dimensional array of pressure data that I need to represent on the surface of the cylinder.I’d like your help if you have an idea how to do it or already worked on something similar
Hello, is your 2D-array the data of your “unrolled” cylinder?
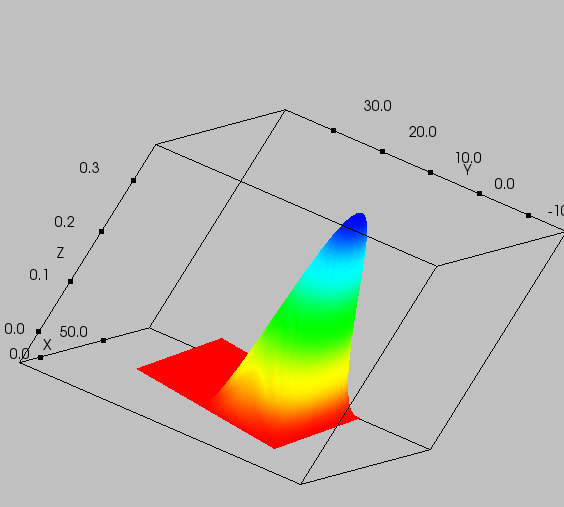
So, your task is to roll your flat geometry into a cylinder like wraping a label around a bottle. Please, take a look at this: matlab - Bending a plane into a closed surface/cylinder - Stack Overflow . You can use the pressure/Z value as a radius multiplier to deform the cylinder to your liking.
If you’re familiar with science-oriented high-level langages like Python/NumPy, R, Julia, etc. you will find the code easy to follow and to implement in C++. If you’re already on Python, the better.
appreciative of advice.