I am trying to create a volume rendering in vtk that resembles the paraview output as closely as possible.
- Is it possible to produce the same volume rendering with paraview and vtk?
- Are there known settings or pipeline changes I need to make in vtk in order to accomplish this?
Example -
Test data set - vtkImageData - Scalar point data - single component scalar with a range of about 0 to 0.4
testdata.vti (3.8 MB)
Basic setup - Load in data. Show as a volume representation. Set color to constant red. Set opacity function as ramp that goes from 0 to 1.
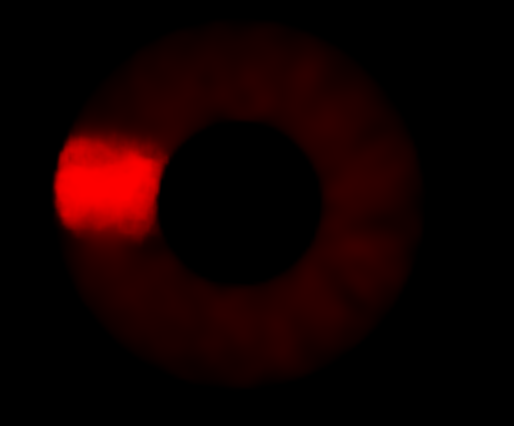
Paraview
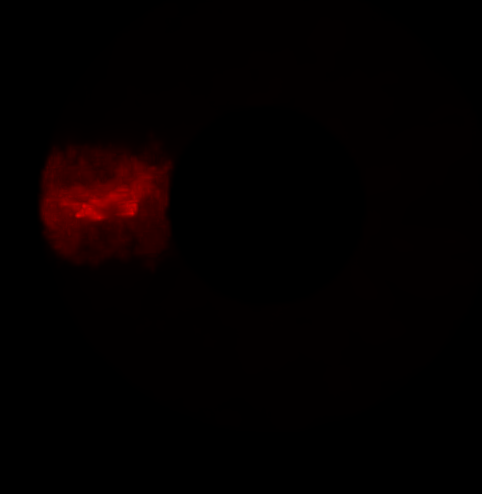
VTK (shown here using vtkplotter)
I had to set the mode=1 (maximum intensity) for the volume rendering to show anything. The default is composite blending mode, which is the same mode used in all/most of the VTK example themselves. In this case, the composite blending mode results in a barely visible volume rendering. I’m not sure why that is. I have also attempted all this with C++ using the smart volume mapper with similar results.
import vtk
from vtkplotter import datadir, load, Volume, show

reader = vtk.vtkXMLImageDataReader()
reader.SetFileName("testdata.vti")
reader.Update()
img = reader.GetOutput()
vol1 = Volume(img, mode=1)
vol1.color(["red", "red"])
vol1.alpha([0, 1])
show(vol1, "vtk plotter", axes=1, resetcam=True, bg='black')
Thank you