Is there a way to plot line that has three dimensions (x, y, z) on two dimensional XY axes and fill the area between this line and some baseline (usually baseline is a constant value line) with color coded by z-values?
In other words the line is represented by three vectors: x, y and z.
Here is the example of it (2nd and 3rd plots): https://www.mathworks.com/matlabcentral/mlc-downloads/downloads/submissions/38691/versions/2/screenshot.png
The problem that it doesn’t work I write the code:
/* Color object */ vtkNew<vtkNamedColors> colors; vtkColor3d color3d = colors->GetColor3d("tomato");
/* Create area object */ vtkPlotArea* area = dynamic_cast<vtkPlotArea*>(chart->AddPlot(vtkChart::AREA)); //
/* select 10 first elements */ vtkNew<vtkIdTypeArray> arrSelect; arrSelect->SetName("Selection"); arrSelect->InsertNextValue(0); arrSelect->InsertNextValue(1); arrSelect->InsertNextValue(2); arrSelect->InsertNextValue(3); arrSelect->InsertNextValue(4); arrSelect->InsertNextValue(5); arrSelect->InsertNextValue(6); arrSelect->InsertNextValue(7); arrSelect->InsertNextValue(8); arrSelect->InsertNextValue(9); area->SetSelection(arrSelect);
/* Fill selected area with specified color */ area->GetSelectionBrush()->SetColorF(color3d.GetRed(), color3d.GetGreen(), color3d.GetBlue(), .6);
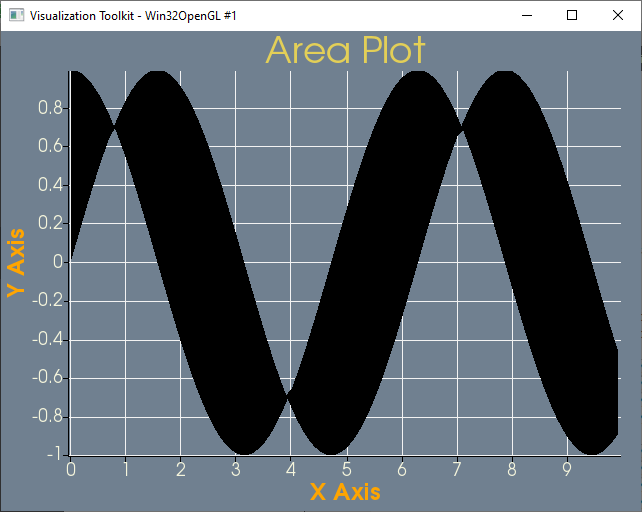
When I run the code the hole area is filled with black (i.e. colors didn’t work).
