Hi, I’m new to VTK and any help would be appreciated.
I’m trying to visualize unstructured data with VTK and Python.
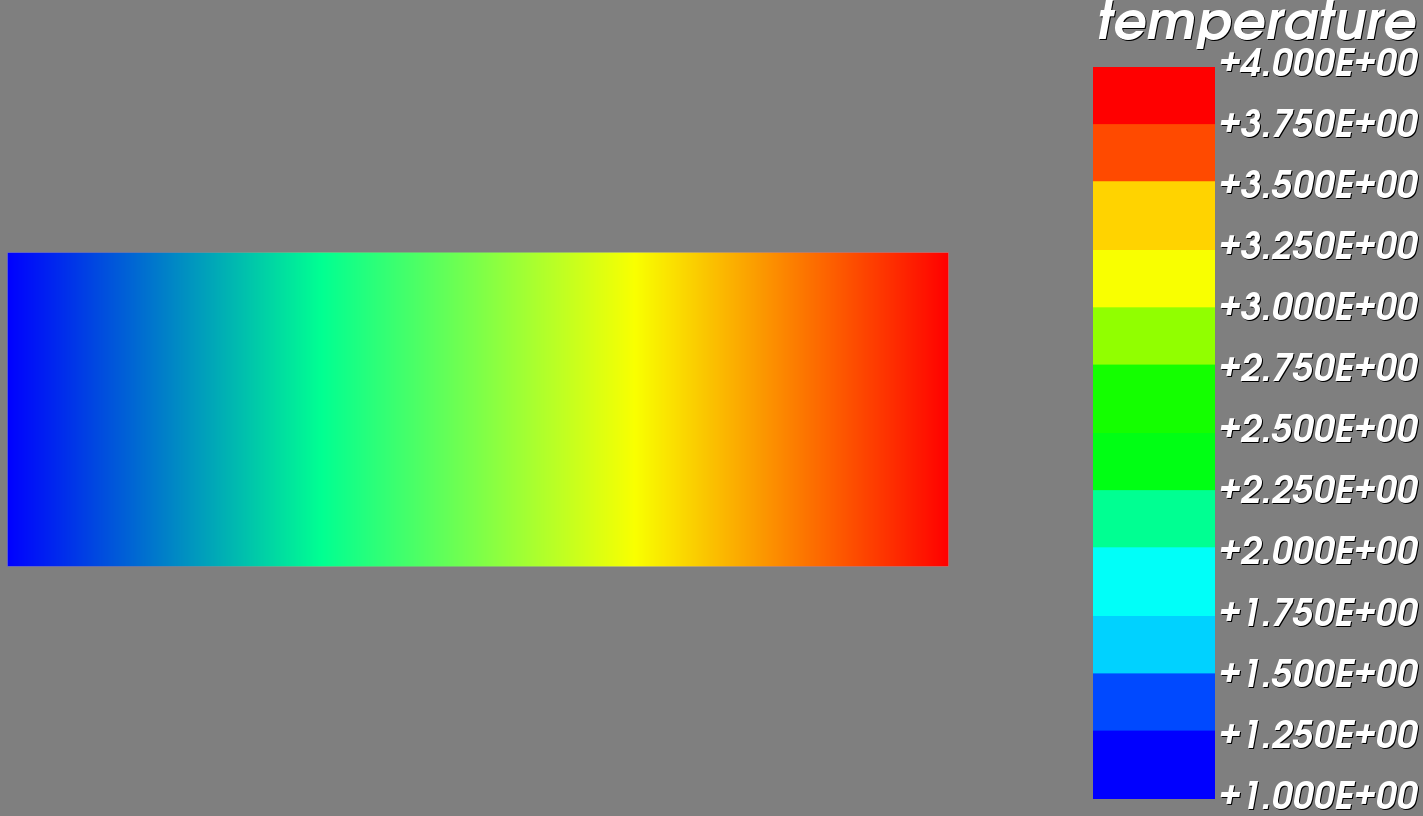
So far I managed to visualize temperature on a plate like this:
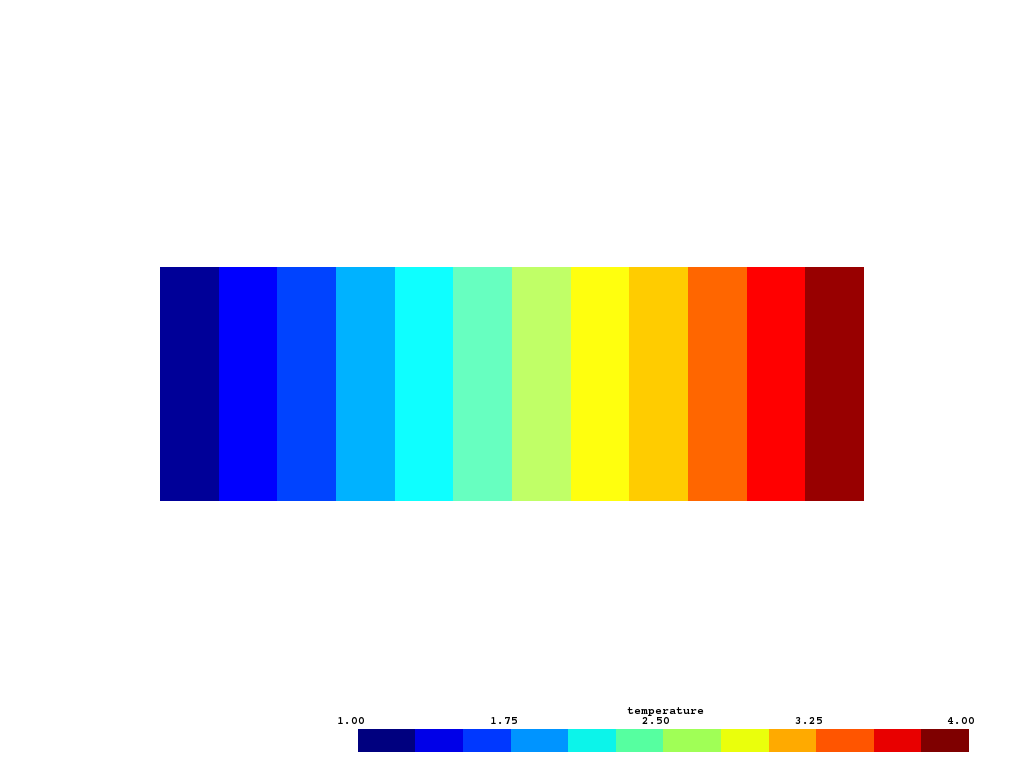
But I need the plate to only show the 12 colors (or any other number of colors), like this:

my python code:
import vtk

# file and scalars name
fileName = "stripSimple.vtk"
scalarsName = "temperature"
numberOfColors = 12

# reader
reader = vtk.vtkUnstructuredGridReader()
reader.SetFileName(fileName)
reader.SetScalarsName(scalarsName)
reader.Update()

# data (scalars) range
dataRange = reader.GetOutput().GetPointData().GetScalars().GetRange()

# lookup table
lut = vtk.vtkLookupTable()
lut.SetNumberOfColors(numberOfColors)
lut.SetHueRange(0.667, 0.0)
lut.Build()

# mapper
dataMapper = vtk.vtkDataSetMapper()
dataMapper.SetInputConnection(reader.GetOutputPort())
dataMapper.SetScalarRange(dataRange)
dataMapper.SetLookupTable(lut)

# dataMapper actor
dataActor = vtk.vtkActor()
dataActor.SetMapper(dataMapper)

# scalarBar actor
scalarBar = vtk.vtkScalarBarActor()
scalarBar.SetLookupTable(lut)
scalarBar.SetTitle(scalarsName)
scalarBar.SetNumberOfLabels(numberOfColors + 1)
scalarBar.SetLabelFormat('%+2.3E')

# renderer
ren = vtk.vtkRenderer()
ren.AddActor(dataActor)
ren.AddActor2D(scalarBar)
ren.SetBackground(0.5, 0.5, 0.5)

# window
renWin = vtk.vtkRenderWindow()
renWin.AddRenderer(ren)
renWin.SetSize(500, 500)

# interactor
iren = vtk.vtkRenderWindowInteractor()
iren.SetRenderWindow(renWin)
iren.SetInteractorStyle(vtk.vtkInteractorStyleTrackballCamera())

# start
iren.Start()
My “stripSimple.vtk” file:
# vtk DataFile Version 3.0

ASCII

DATASET UNSTRUCTURED_GRID
POINTS 8 float
0 0 2
1 0 2
1 1 2
0 1 2
2 0 2
3 0 2
3 1 2
2 1 2

CELLS 6 24
3 0 1 2
3 0 2 3
3 1 4 2
3 4 7 2
3 4 5 7
3 5 6 7

CELL_TYPES 6
5
5
5
5
5
5

POINT_DATA 8
SCALARS temperature float 1
LOOKUP_TABLE default
1.0 2.0 2.0 1.0
3.0 4.0 4.0 3.0

SCALARS density float 1
LOOKUP_TABLE default
-6.0 1.0 2.0 -1.0
9.0 4.0 -5.0 9.0

CELL_DATA 6
SCALARS subdomains int 1
LOOKUP_TABLE default
0 0 1 1 2 2